Korelasi Pearson - Matematika Wajib SMA Kelas XI Kurikulum Merdeka
Summary
TLDRThis video from BSM Channel explains correlation analysis for 11th-grade mathematics, focusing on understanding and applying Pearson's correlation method. It covers key concepts such as the correlation coefficient (r), indicating the strength of a linear relationship between two variables, and the coefficient of determination (R²), showing the percentage influence of the independent variable on the dependent variable. The video provides step-by-step calculations using sample data on training duration and 100-meter sprint times, demonstrating how to determine the strength and impact of the relationship. It emphasizes practical understanding and encourages applying these methods to analyze quantitative data effectively.
Takeaways
- 📘 Correlation analysis is used to identify the pattern and strength of the relationship between two or more variables.
- 📊 The main focus of correlation analysis is determining how strongly an independent variable is related to a dependent variable.
- 📐 The correlation coefficient, symbolized by r, indicates the strength and direction of a linear relationship between two variables.
- 🧮 Correlation coefficient values always range between -1 and 1, where values closer to ±1 indicate stronger relationships.
- 📈 Correlation strength can be classified into levels such as very weak, weak, moderate, strong, very strong, and perfect.
- 📝 Different references may use different interval classifications for interpreting correlation strength.
- 🎯 The coefficient of determination (R² or KD) measures how much influence the independent variable has on the dependent variable.
- 📉 The coefficient of determination is calculated using the formula R² × 100% and is usually expressed as a percentage.
- 🔍 Pearson correlation is one of the most commonly used methods for analyzing linear relationships between quantitative variables.
- 📚 Pearson correlation is suitable for interval or ratio scale data that follow a linear trend.
- 🧠 Before calculating correlation, it is important to correctly identify the independent variable (X) and dependent variable (Y).
- 📋 Solving Pearson correlation problems requires calculating several components such as ΣX, ΣY, ΣXY, ΣX², and ΣY².
- ➗ The Pearson correlation formula involves covariance and standard deviation calculations to obtain the value of r.
- 🏃 In the example problem, training duration was treated as the independent variable and running time as the dependent variable.
- 📊 The calculated Pearson correlation coefficient in the example was r = -0.953, indicating a very strong relationship.
- ⚡ A negative correlation means that as training duration increases, running time decreases.
- 📈 The coefficient of determination in the example was about 90.82%, meaning training duration had a major influence on running performance.
- 🔬 The remaining 9.18% of influence on running performance could come from other factors such as nutrition or supplements.
- 🛠️ Using calculators or other calculation tools is acceptable when solving correlation analysis problems involving large computations.
- 🎓 Practicing with additional exercises and examples is recommended to better understand Pearson correlation analysis.
Q & A
What is the main purpose of correlation analysis in statistics?
-The main purpose of correlation analysis is to identify the pattern and strength of the relationship between two or more variables, expressed using a correlation coefficient.
What does the correlation coefficient (R) indicate?
-The correlation coefficient (R) indicates the strength and direction of a linear relationship between two variables. Its value ranges from -1 to 1, where values closer to 1 or -1 represent stronger correlations.
How is the strength of a correlation categorized?
-The strength of correlation is categorized based on intervals of the correlation coefficient, such as very weak, weak, moderate, strong, very strong, and perfect. For example, a correlation of 0.953 would be considered very strong.
What is the difference between the correlation coefficient and the coefficient of determination?
-The correlation coefficient measures the strength and direction of a relationship, while the coefficient of determination (R²) shows the percentage of the dependent variable explained by the independent variable, reflecting the magnitude of influence.
How is the coefficient of determination calculated?
-The coefficient of determination is calculated by squaring the correlation coefficient and multiplying by 100%. For example, if R = -0.953, then R² = (-0.953)² × 100% = 90.8%, meaning the independent variable explains 90.8% of the variation in the dependent variable.
What type of data is suitable for the Pearson correlation method?
-The Pearson correlation method is suitable for quantitative data that are interval or ratio-scaled and follow a linear trend.
In the example of running practice, which is the independent variable and which is the dependent variable?
-In the example, the independent variable (X) is the duration of training per week, while the dependent variable (Y) is the 100-meter running time, because the duration of training affects the running performance.
What are the steps to calculate the Pearson correlation coefficient?
-To calculate the Pearson correlation coefficient, identify the independent and dependent variables, construct a table for X, Y, X*Y, X², and Y², compute the sums (ΣX, ΣY, ΣXY, ΣX², ΣY²), and then substitute these into the Pearson formula: r = [nΣXY - (ΣX)(ΣY)] / √[(nΣX² - (ΣX)²)(nΣY² - (ΣY)²)].
What is the interpretation of a Pearson correlation coefficient of -0.953?
-A Pearson correlation coefficient of -0.953 indicates a very strong negative linear relationship, meaning that as the independent variable increases, the dependent variable decreases significantly.
How can a calculator help in correlation analysis?
-A calculator helps in performing multiplication, squaring, and square root operations more efficiently, which simplifies the calculation of correlation and determination coefficients, especially when dealing with large datasets.
Outlines

Esta sección está disponible solo para usuarios con suscripción. Por favor, mejora tu plan para acceder a esta parte.
Mejorar ahoraMindmap

Esta sección está disponible solo para usuarios con suscripción. Por favor, mejora tu plan para acceder a esta parte.
Mejorar ahoraKeywords

Esta sección está disponible solo para usuarios con suscripción. Por favor, mejora tu plan para acceder a esta parte.
Mejorar ahoraHighlights

Esta sección está disponible solo para usuarios con suscripción. Por favor, mejora tu plan para acceder a esta parte.
Mejorar ahoraTranscripts

Esta sección está disponible solo para usuarios con suscripción. Por favor, mejora tu plan para acceder a esta parte.
Mejorar ahoraVer Más Videos Relacionados
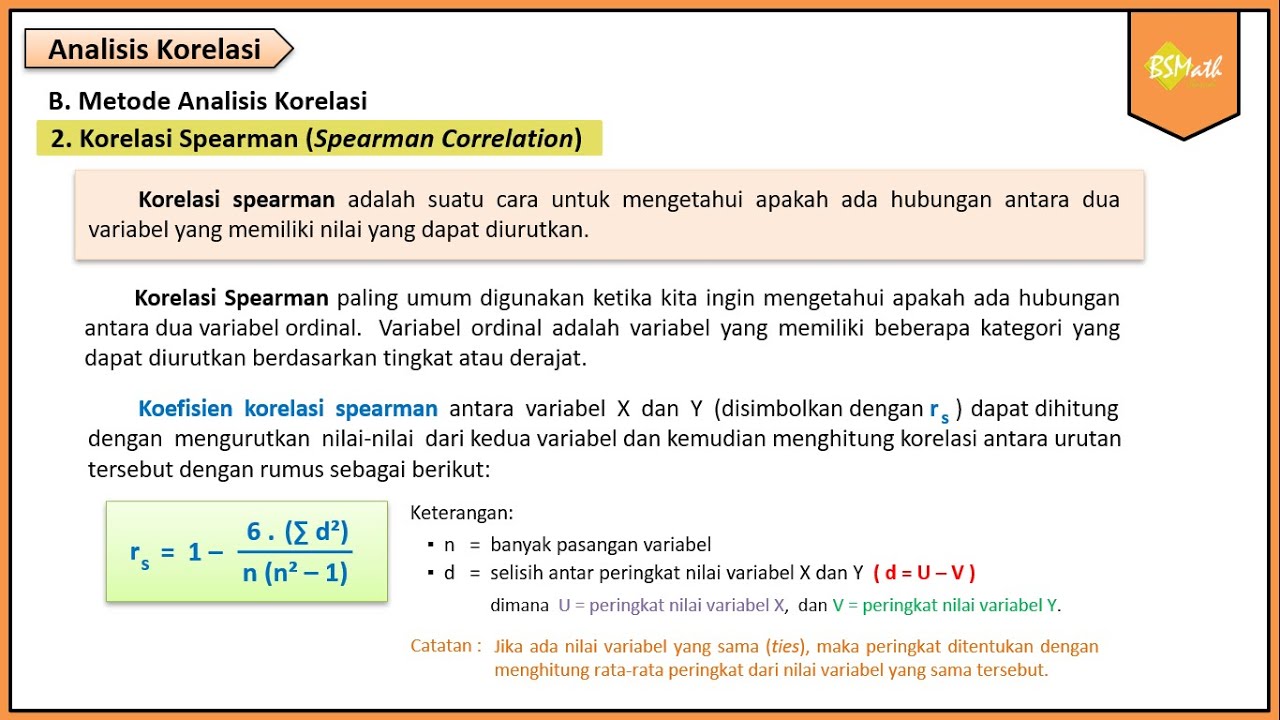
Korelasi Spearman - Matematika Wajib SMA Kelas XI Kurikulum Merdeka

LATIHAN 3 (KORELASI PEARSON) BAB 2 REGRESI DAN KORELASI (Matematika 11B)
04 Correlation in SPSS – SPSS for Beginners
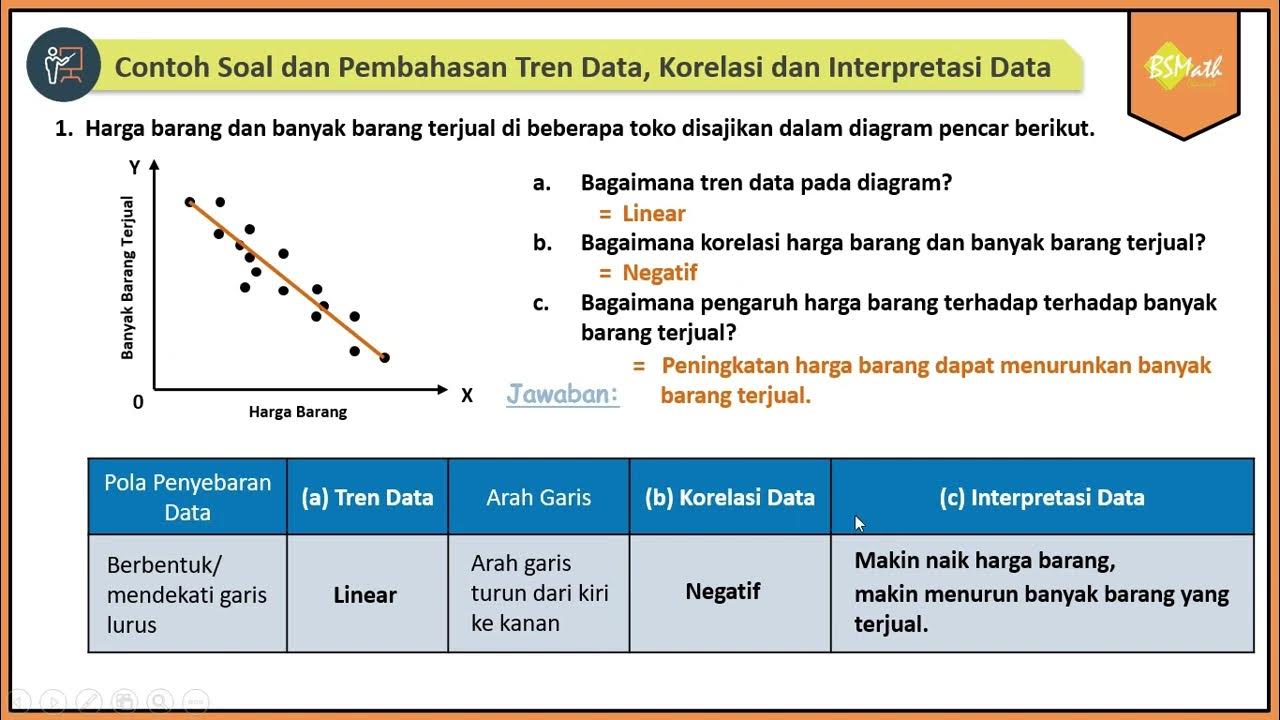
Contoh Soal dan Pembahasan Tren Data, Korelasi dan Interpretasi Data Bivariat Diagram Pencar

Correlation Analysis
Spearmen's Rank Correlation || Gnani The Knowledge ||
5.0 / 5 (0 votes)
