Contoh Cara Menghitung Analisis Vertikal / Horizontal Laporan Keuangan

AnalisSaham Syariah
10 Oct 202014:20

Summary

TLDRThis video script offers a comprehensive tutorial on financial statement analysis, focusing on both vertical and horizontal analysis. It guides viewers on how to use a stock calculator from analis.co.id for these analyses. Vertical analysis is explained as comparing parts of a single financial statement, exemplified by calculating the cash ratio. Horizontal analysis is detailed as comparing financial statements across different periods, using data from at least two periods. The script also highlights the benefits of using the provided calculator for ease and accuracy in analysis.

Takeaways

  • 📈 The video discusses financial analysis techniques, specifically vertical and horizontal analysis of financial statements.
  • 🔢 Vertical analysis involves comparing different parts of a single financial statement to understand the proportionate relationships between them.
  • 💹 An example of vertical analysis is calculating the quick ratio by dividing the quick assets by short-term liabilities.
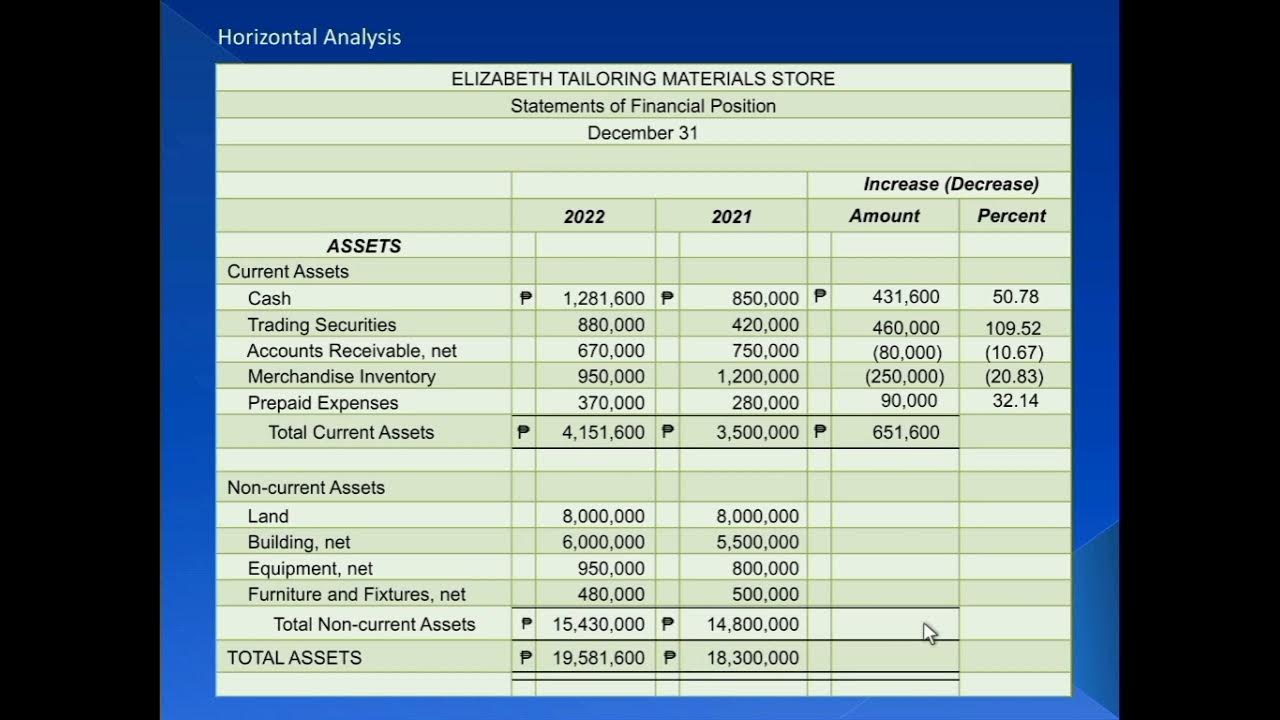
  • 📊 Horizontal analysis compares a financial statement with another over different periods, such as comparing the financial data of 2017 with that of 2016.
  • 📚 The video introduces a stock calculator tool from analis.co.id to facilitate these analyses without manual calculations.
  • 💼 The tool automatically presents the results of horizontal analysis in percentage form, making it easier to understand changes over time.
  • 📊 Horizontal analysis can also be performed by comparing the same ratio across different years, such as comparing the return on equity (ROE) over multiple years.
  • 💡 The video emphasizes the importance of both vertical and horizontal analyses for a comprehensive understanding of a company's financial health.
  • 📝 The presenter provides a detailed explanation of how to use the stock calculator tool and where to find it on the website.
  • 🔑 Key financial ratios such as liquidity, profitability, activity, solvency, and market evaluation ratios are mentioned as part of vertical analysis.
  • 🌐 The video concludes with a reminder to subscribe and visit the analis.co.id blog for more information and tools.

Q & A

  • What are the two types of financial analysis discussed in the script?

    -The script discusses vertical analysis and horizontal analysis of financial statements.

  • What does vertical analysis of financial statements involve?

    -Vertical analysis involves comparing each part of a financial statement to another part within the same statement, such as comparing assets to liabilities or equity.

  • Can you provide an example of a vertical analysis calculation mentioned in the script?

    -Yes, an example given is calculating the quick ratio by dividing cash and cash equivalents by short-term liabilities.

  • What is horizontal analysis of financial statements?

    -Horizontal analysis involves comparing one financial statement with another over different periods, typically year over year.

  • How do you perform a horizontal analysis according to the script?

    -To perform a horizontal analysis, you need data from at least two different financial statements and compare the data from one period to another.

  • What is the purpose of using the 'kalkulator saham' from analis.co.id as mentioned in the script?

    -The 'kalkulator saham' is used to perform financial analysis without the need for manual calculations, as it automatically computes the results in percentage form.

  • What is the significance of Return on Equity (ROE) in vertical analysis as discussed in the script?

    -Return on Equity (ROE) is significant in vertical analysis because it compares net profit to total equity, providing insight into how efficiently a company is using its equity to generate profit.

  • What are some of the financial ratios that can be calculated using vertical analysis according to the script?

    -Financial ratios that can be calculated using vertical analysis include liquidity ratios, profitability ratios, activity ratios, solvency ratios, and market evaluation ratios.

  • What is the main difference between vertical and horizontal analysis as presented in the script?

    -The main difference is that vertical analysis compares parts of the same financial statement, while horizontal analysis compares the same parts of different financial statements over time.

  • Why is it recommended to perform both vertical and horizontal analyses as suggested in the script?

    -Performing both analyses provides a more comprehensive understanding of a company's financial health by evaluating changes over time and the internal structure of financial statements.

  • How can one access the 'kalkulator saham' mentioned in the script?

    -One can access the 'kalkulator saham' by visiting analis.co.id, navigating to the 'tools' section, and then clicking on 'kalkulator saham'.

Outlines

00:00

📊 Introduction to Financial Analysis

The speaker begins by greeting the audience and introducing the topic of Shariah stock analysis. They explain that in this session, they will discuss vertical and horizontal financial statement analysis. The speaker encourages new visitors to subscribe and click the bell icon for updates. They mention the use of a stock calculator from the website 'analis.co.id' and guide the audience on how to access it. The explanation then shifts to vertical analysis of financial statements, which involves comparing different parts of a single financial statement, such as assets, liabilities, and equity. An example of calculating the cash ratio is provided to illustrate the process. The speaker emphasizes that vertical analysis is about comparing one part of the financial statement to another, either from bottom to top or vice versa.

05:02

🔍 Deep Dive into Vertical Analysis

This paragraph delves deeper into vertical analysis, explaining that it involves calculating various financial ratios by comparing different sections of a financial statement within the same period. The speaker provides an example of calculating the return on equity (ROE) to demonstrate vertical analysis. They also touch upon the difference between vertical and horizontal analysis, with the latter involving comparisons between different financial statements over time. The speaker introduces a stock calculator tool that automates the process of horizontal analysis, displaying results as percentages. The audience is encouraged to input data for the past five years to see the results of horizontal analysis, which can also be performed on financial ratios rather than raw data.

10:19

📈 Examples of Vertical and Horizontal Analysis

The speaker provides examples of both vertical and horizontal financial statement analysis. They discuss how to perform horizontal analysis by comparing ratios across different years, such as comparing the return on equity (ROE) from one year to the next. The speaker emphasizes the importance of understanding both types of analysis for a comprehensive financial evaluation. They conclude by summarizing the key points of vertical analysis, which involves comparing various financial ratios within the same financial statement, and horizontal analysis, which compares the same financial ratios across different years. The speaker also reminds the audience of the benefits of using the stock calculator tool for these analyses and invites them to visit the website for more information.

Mindmap

Keywords

💡Vertical Analysis

Vertical analysis, also known as common size analysis, is a method used to evaluate financial statements by expressing each item as a percentage of a base figure. In the context of the video, it refers to analyzing a single financial statement by comparing different parts of it, such as comparing the current assets to total assets or current liabilities to total liabilities. The video script mentions performing vertical analysis on a financial report to understand the proportionate relationship between different financial items.

💡Horizontal Analysis

Horizontal analysis is a technique used to compare financial data over multiple periods to identify trends. It involves calculating the percentage change in financial statement items from one period to the next. In the video, horizontal analysis is discussed as a method to compare financial statements across different years to observe changes and trends, such as comparing the cash and cash equivalents from one year to the next.

💡Financial Ratios

Financial ratios are quantitative measures used to evaluate a company's financial performance. They are calculated by dividing one number by another and are used to assess profitability, liquidity, solvency, and other financial metrics. The video script discusses various financial ratios such as liquidity ratios, profitability ratios, activity ratios, solvency ratios, and market evaluation ratios, which are used in both vertical and horizontal analyses.

💡Liquidity Ratios

Liquidity ratios are financial metrics used to determine a company's ability to meet its short-term obligations. They include ratios like the current ratio and quick ratio. In the video, liquidity ratios are mentioned as part of the vertical analysis where the presenter calculates the cash ratio by dividing cash and cash equivalents by short-term liabilities to assess the company's liquidity.

💡Profitability Ratios

Profitability ratios are financial metrics that measure a company's ability to generate profits relative to its revenue, assets, or shareholders' equity during a period. Examples include net profit margin and return on equity. The video script includes an example of a profitability ratio, return on equity, which is calculated by dividing net income by total equity.

💡Solvency Ratios

Solvency ratios are financial metrics that measure a company's ability to meet its long-term obligations. They assess the company's financial leverage and stability. Although not explicitly mentioned in the script, solvency ratios would be relevant to the discussion of financial health in the context of vertical and horizontal analyses.

💡Activity Ratios

Activity ratios, also known as efficiency ratios, measure how efficiently a company is using its assets to generate sales. Examples include the asset turnover ratio and inventory turnover ratio. While not directly mentioned in the script, activity ratios would be relevant to the analysis of how effectively a company is operating its assets.

💡Market Evaluation Ratios

Market evaluation ratios compare a company's stock price to its financial performance metrics. Examples include the price-to-earnings (P/E) ratio and price-to-book (P/B) ratio. The video script refers to market evaluation ratios when discussing the analysis of stock values in relation to financial data, such as comparing the current P/B ratio with those of previous years.

💡Financial Statement

A financial statement is a formal record of a company's financial activities, including the balance sheet, income statement, and cash flow statement. The video script discusses analyzing financial statements, specifically focusing on the balance sheet and income statement, to perform vertical and horizontal analyses.

💡Stock Calculator

A stock calculator is a tool used to perform various calculations related to stocks, such as financial ratios, to help investors make informed decisions. The video script mentions using a stock calculator from analis.co.id to perform vertical and horizontal analyses of financial statements, indicating that such tools can simplify the process of manual calculations.

💡Return on Equity (ROE)

Return on Equity (ROE) is a financial ratio that measures the return a company generates for its shareholders relative to the total equity on its balance sheet. It is calculated by dividing net income by total equity. In the video, ROE is used as an example of a profitability ratio in vertical analysis, demonstrating how to compare the net income to total equity to assess the company's efficiency in using equity to generate profits.

Highlights

Introduction to financial analysis techniques: vertical and horizontal analysis of financial statements.

Explanation of how to perform vertical analysis by comparing different parts of a single financial statement.

Example of calculating the quick ratio as part of vertical analysis.

Description of the direction of vertical analysis, either from bottom to top or top to bottom within financial statement sections.

Discussion on various financial ratios that can be used for vertical analysis.

Introduction to horizontal analysis comparing one financial statement to another over time.

Explanation of how to perform horizontal analysis with a step-by-step example.

Mention of a financial analysis calculator tool available on analis.co.id.

Advantage of using the calculator tool for automatic calculation of horizontal analysis results.

Emphasis on the importance of understanding financial ratios for both vertical and horizontal analysis.

Example of calculating return on equity (ROE) as part of vertical analysis.

Differentiation between vertical and horizontal analysis in terms of data comparison.

Practical application of horizontal analysis using data from different years to identify trends.

Explanation of how to use the calculator tool to input data and automatically receive analysis results.

The importance of conducting both vertical and horizontal analyses for a comprehensive financial statement review.

Encouragement for viewers to subscribe and use the tools provided on analis.co.id for financial analysis.

Conclusion summarizing the key takeaways from the video on financial statement analysis.

Transcripts

play00:00

Hai high salamualaikum warahmatullahi

play00:03

wabarakatuh sumpah lagi teman-teman

play00:06

analis saham Syariah jadi Pada

play00:09

kesempatan kali ini kita akan bahas soal

play00:14

analisis vertikal dan analisis

play00:25

horizontal laporan keuangan jadi

play00:27

teman-teman yang bertanya soal cara

play00:30

menghitung analisis vertikal atau cara

play00:33

menghitung analisis horizontal laporan

play00:36

keuangan Seperti apa Nah kita akan bahas

play00:38

Pada kesempatan kali ini nah buat

play00:41

teman-teman yang baru berkunjung jangan

play00:42

lupa subscribe dan Klik tombol

play00:44

loncengnya Oke blog analis.co.id nah

play00:48

kita langsung bahas jadi disini kita

play00:51

menggunakan kalkulator saham dari

play00:56

analis.co.id jadi buat teman-teman

play01:00

mau kalkulator ini silahkan masuk kesini

play01:03

tools kemudian klik kalkulator saham

play01:09

Excel dan teman-teman akan masuk ke

play01:12

halaman ini kemudian teman-teman tinggal

play01:18

order Oke teman-teman kita langsung jadi

play01:23

analisis acara analisis

play01:27

Hai vertikal laporan keuangan dulu jadi

play01:30

kita harus buka dulu satu laporan

play01:33

keuangan

play01:35

Hai laporan keuangan sebagai kita buka

play01:45

PDA nah yang dimaksud dengan analisis

play01:59

vertikal laporan keuangan adalah jadi

play02:04

kita melakukan analisis berdasarkan data

play02:08

yang ada dalam satu laporan keuangan

play02:11

jadi kalau teman-teman misalnya membuka

play02:14

laporan keuangan susunannya seperti ini

play02:16

ada aset liabilitas dan ekuitas maka

play02:21

analisis vertikal yang kita lakukan itu

play02:23

kita membandingkan antara satu bagian

play02:29

laporan keuangan dengan bagian yang

play02:31

lainnya misalnya di

play02:35

rasio kas jadi dirumus ini cerdas dibagi

play02:43

kolom i22 jadii 1111 kas dibagi dengan

play02:51

liabilitas jangka pendek jadi yang

play02:57

dimaksud dengan analisis vertikal

play02:59

laporan keuangan jadi kita membandingkan

play03:02

antara satu bagian laporan keuangan

play03:04

dengan bagian lainnya nah pada kasus ini

play03:09

kita menghitung rasio khasnya jadi rasio

play03:14

kas yang kita hitung kita bandingkan

play03:17

antara khas dengan maaf Jadi kita

play03:25

bandingkan antara

play03:29

e-cash dengan liabilitas jangka pendek

play03:33

jadi di sini kita bagi antara khas dan

play03:39

setara kas kita bagi dengan data dari

play03:43

liabilitas jangka pendek Nah itulah

play03:45

salah satu contoh analisis vertikal

play03:48

vertikal maksudnya jadi kita arahnya

play03:53

adalah dari bawah keatas atau dari atas

play03:55

ke bawah dari bagian-bagian laporan

play03:57

keuangan yang ada yaitu aset liabilitas

play04:00

dan ekuitas nah buat teman-teman yang

play04:03

bertanya apa saja analisis vertikal

play04:06

laporan keuangan yang bisa kita lakukan

play04:08

Jadi kalau teorinya melakukan analisis

play04:12

vertikal laporan keuangan itu bisa dari

play04:16

berbagai data laporan keuangan jadi

play04:18

terkait pertanyaan teknik atau contoh

play04:22

soal analisis laporan keuangan maka

play04:27

ketika

play04:29

teman-teman sudah tahu rasio

play04:32

profitabilitas itu seperti apa rasio

play04:35

likuiditas kemudian rasio aktivitas

play04:38

rasio solvabilitas dan rasio evaluasi

play04:41

atau pasar maka yang dimaksud dengan

play04:44

rasio yang dimaksud dengan analisis

play04:47

vertikal laporan keuangan adalah kita

play04:52

membandingkan antara satu bagian laporan

play04:54

keuangan dengan bagian lainnya seperti

play04:57

yang kita jelaskan tadi tapi

play04:59

implementasinya atau pelaksanaannya

play05:01

adalah kalau teman-teman sudah tahu

play05:04

semua rasio ini Maka itulah yang

play05:05

dinamakan analisis vertikal jadi data

play05:10

yang kita buat atau perhitungan yang

play05:15

kita buat itu sebenarnya yang dimaksud

play05:18

dengan analisis vertikal yang ya ini

play05:21

semua jadi rasio-rasio ini adalah hasil

play05:24

analisis vertikal teman-teman jadi rasio

play05:27

kas rasio lancar ini adalah

play05:29

sebagian dari analisis vertikal Kenapa

play05:31

karena kita menghitung dengan

play05:35

membandingkan antara satu bagian laporan

play05:37

keuangan dengan bagian yang lainnya

play05:39

dalam satu periode yang sama jadi dalam

play05:44

satu laporan keuangan nah perbedaannya

play05:48

dengan nangis orizontal akan kita

play05:50

Jelaskan Pak sebentar kita buat satu

play05:53

contoh lagi jadi jantung sederhana ini

play05:56

adalah salah satu rasul yang sering

play05:58

digunakan return on equity jadi rumusnya

play06:01

adalah 40 bagi 28 terhenti kolom i.bri

play06:07

40 laba bersih dibagi dengan baris 28

play06:12

adalah total ekuitas nah ini juga adalah

play06:16

analisis vertikal Kenapa karena kita

play06:20

membandingkan dari atas ke bawah atau

play06:22

dari bawah ke atas dalam satu bagian

play06:24

laporan keuangan yaitu antara neraca dan

play06:28

laba

play06:29

ping nah kemudian caraanalisis

play06:35

horizontal laporan keuangan Seperti apa

play06:38

teorinya jadi tekniknya teman-teman

play06:40

bicara soal analisis horizontal maka itu

play06:46

artinya kita membandingkan antara satu

play06:49

laporan keuangan dengan satu laporan

play06:52

keuangan lainnya nah caranya teman-teman

play06:56

harus punya data dari minimal dua

play06:59

laporan keuangannya contoh sederhana

play07:02

misalnya kita punya data kas dan setara

play07:05

kas 2017 saat ini Angkatlah saat ini

play07:10

bukan 2020 2017 Nah untuk melakukan

play07:13

analisis horizontal teman-teman

play07:16

bandingkan data 2017 ini dengan data

play07:20

tahun 2016 Kemudian untuk mengetahui

play07:24

hasilnya maka teman-teman hitung dulu

play07:27

Berapa perbedaannya kemudian hitung

play07:29

presentasinya Nah itulah hasil dari

play07:32

analisis horizontal atau teman-teman

play07:36

mencari data yang lebih banyak lagi

play07:39

misalnya data lima tahun terakhir Nah

play07:42

inilah Kenapa kalkulator saham XL ini

play07:46

dibuat selengkap ini agar teman-teman

play07:48

ketika mau melakukan analisis itu tidak

play07:52

perlu repot menghitung secara manual

play07:56

karena ketika teman-teman mengisi

play07:58

datanya disini maka hasil analisis

play08:00

horizontalnya akan muncul di sini secara

play08:03

otomatis dalam bentuk angka persentase

play08:07

nya jadi teman-teman disini cukup mudah

play08:10

kan jadi kalau mau melakukan analisis

play08:13

horizontal maka isi data ini Anggaplah

play08:17

kita menggunakan analisis laporan

play08:19

keuangan tahunan bukan Kuartal jadi

play08:21

teman-teman a misalnya mau melakukan

play08:25

analisis horizontal dari kas dan setara

play08:28

kas

play08:29

Hai makan teman-teman isi data khas

play08:32

Disini di lima tahun terakhir nah

play08:36

kemudian hasilnya akan muncul di sini

play08:38

Nah inilah hasil analisis horizontal

play08:42

kita jadi karena bentuknya adalah datar

play08:46

dari tahun sebelumnya hingga tahun saat

play08:51

ini Maka itulah yang kita namakan

play08:53

analisis horizontal dan bisa juga

play08:56

analisis horizontal itu bukan dari angka

play08:59

data laporan keuangan teman-teman bisa

play09:02

juga analisis horizontal dilakukan

play09:05

dengan membandingkan antara saturatio

play09:10

dengan rasio yang sama di tahun yang

play09:14

berbeda atau dikeluarkan yang berbeda

play09:16

maksudnya misalnya kita Contohkan rasio

play09:21

pbv atau price to book value atau price

play09:25

to book value review di

play09:29

jikalau kita menghitung melakukan

play09:33

analisis atau analisa horizontal dengan

play09:39

membandingkan antara satu nilai pipi

play09:41

dengan TV lainnya maka angka yang kita

play09:44

pakai adalah angka nilai PV saat ini

play09:48

dengan nilai TV sebelumnya mencoba teman

play09:51

saya perlihatkan Biar lebih jelas

play09:54

Maksudnya seperti ini jadi oke nah kita

play10:19

lihat teman-teman saya

play10:29

Hai nah ini adalah salah satu contoh

play10:33

analisis vertikal laporan keuangan Anda

play10:38

lima contoh analisis horizontal laporan

play10:40

keuangan Oke kita ambil contoh yang lain

play10:58

cewek-cewek Maaf ah kita ambil contoh

play11:02

yang Nah teman-teman kalau kita

play11:06

melakukan analisis horizontal laporan

play11:11

keuangan dari hasil perhitungan rasionya

play11:14

Nah contoh seperti ibu kita punya data

play11:17

rasio aritenoid PT dari saham jpfa tahun

play11:24

2019 maka untuk melakukan analisis

play11:27

horizontal berdasarkan

play11:29

angka berdasarkan angka rasio maka kita

play11:33

bandingkan dengan beberapa data ratio

play11:37

return on equity di beberapa tahun

play11:41

sebelumnya Nah kalau kita sudah

play11:43

membandingkan ini misalnya kita untuk

play11:46

tahu hasilnya misalnya kita cari nilai

play11:48

rata-ratanya berapa Nah itulah hasil

play11:50

analisis horizontal kita jadi kalau

play11:53

misalnya kita hitung jumlah ini kita

play11:56

jumlahkan semua Kemudian kita bagi 5

play11:59

Maka itulah hasil analisis horizontal

play12:02

kita dari ratio return on equity Jadi

play12:06

sebelum mengakhiri video ini saya mau

play12:09

menjelaskan menyimpulkan jadi dalam

play12:11

analisis vertikal maka yang kita hitung

play12:14

adalah kita bandingkan antara data asset

play12:18

liabilities sekuritas maupun laba rugi

play12:20

apa saja bisa kita hitung disini dengan

play12:23

berbagai jenis rasio keuangan nah disini

play12:28

teman-teman kalau sudah punya

play12:29

kalkulatornya semua rasul itu sudah

play12:32

lengkap disini bahkan yang ajaran

play12:34

digunakan dan yang sering digunakan itu

play12:37

sudah dihitung disini Nah inilah semua

play12:39

analisis rasio analisis vertikal laporan

play12:44

keuangan yang teman-teman lakukan Jadi

play12:46

kalau bertanya Bagaimana cara nanti Sis

play12:48

maka hitung saja hasilnya itu sudah

play12:50

masuk kategori analisis vertikal laporan

play12:53

keuangan Nah selanjutnya nih vertikal

play12:56

maka teman-teman bisa membandingkan

play12:58

antara tahun saat ini dengan tahun

play12:59

sebelumnya atau yang lebih tinggi

play13:01

teman-teman punya data lima tahun

play13:03

terakhir kemudian melihat hasilnya

play13:06

presentasenya disini Nah itulah hasil

play13:09

analisis horizontal laporan keuangannya

play13:11

teman-teman lakukan nah kalaupun mau

play13:15

lebih lengkap teman-teman bisa melakukan

play13:17

analisis horizontal dari rasio keuangan

play13:20

bukan data Nah kalau dari rasio keuangan

play13:23

maka itu kita sudah Tunjukkan disini

play13:25

teman-teman hitung misalnya punya daftar

play13:28

5 tahun terakhir

play13:29

Hai data rasio laporan keuangan yaitu

play13:32

tiga poin penting yang teman-teman harus

play13:34

ketahui Jadi kalau pertanyaan kelebihan

play13:38

dan kekurangan analisis vertikal dan

play13:40

horizontal sebenarnya untuk melakukan

play13:44

analisis yang lebih komplit teman-teman

play13:46

lakukan kedua analisis tersebut jadi

play13:50

soal contoh soal maupun teknik itu sudah

play13:52

kita berikan tadi silahkan teman-teman

play13:55

dipahami kembali videonya dan Buat yang

play13:59

mau memiliki kalkulator saham

play14:00

teman-teman masuk disini tools

play14:03

calculators and excel di blog

play14:05

analis.co.id Bagaimana mungkin itu yang

play14:09

bisa kita sampaikan buat yang baru

play14:11

berkunjung jangan lupa subscribe dan

play14:13

Klik tombol loncengnya dan berkunjung ke

play14:15

blog analis.co.id Ok Sekian dari saya

play14:17

salam alaykum warahmatullah

Rate This

5.0 / 5 (0 votes)

Etiquetas Relacionadas
Financial AnalysisVertical AnalysisHorizontal AnalysisRatio CalculationFinancial RatiosInvestment ToolsStock AnalysisFinancial HealthShariah StocksInvestment Strategy
¿Necesitas un resumen en inglés?