Candle Range Theory Explained

Solomon King
25 Jul 202418:39

Summary

TLDRIn this video, Solomon King explains the Candle Range Theory, a popular concept in trading that rebrands the Power of Three theory. He emphasizes that each candlestick represents a range, encapsulating the market's movement within a specific timeframe. King illustrates how to spot high and low-probability candle ranges and their importance in aligning with key trading levels. The video also explores different scenarios of candle range formations and practical strategies for using this concept effectively in trading. King concludes by highlighting the significance of aligning candle ranges with key levels to optimize trading decisions.

Takeaways

  • 📈 The concept of Candle Wrench Theory is introduced as a rebranded version of the popular 'Power of Three' concept in trading.
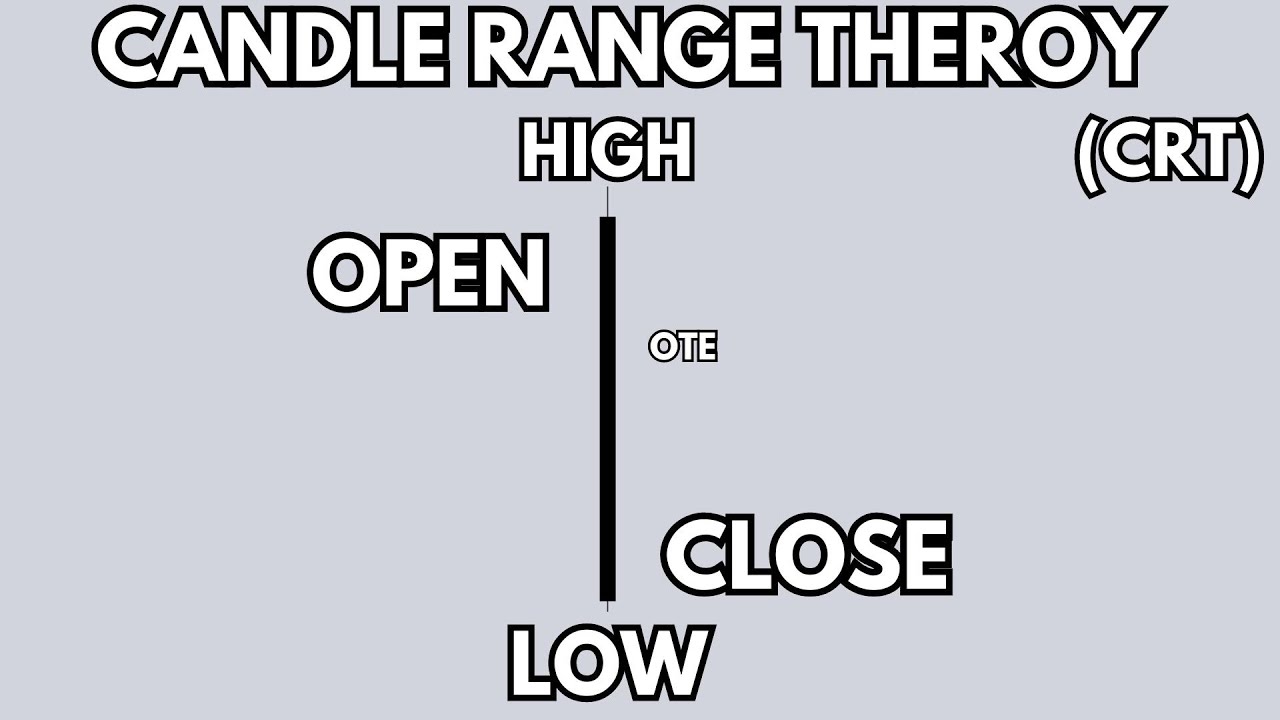
  • 🕒 A candle represents the entire range of transactions that occurred within a specific time frame, such as a day or 15-minute period.
  • 📊 The importance of understanding candle range is emphasized for traders to interpret market movements accurately.
  • 🔍 The video aims to teach viewers how to identify high and low probability candle ranges to align with their trading strategies.
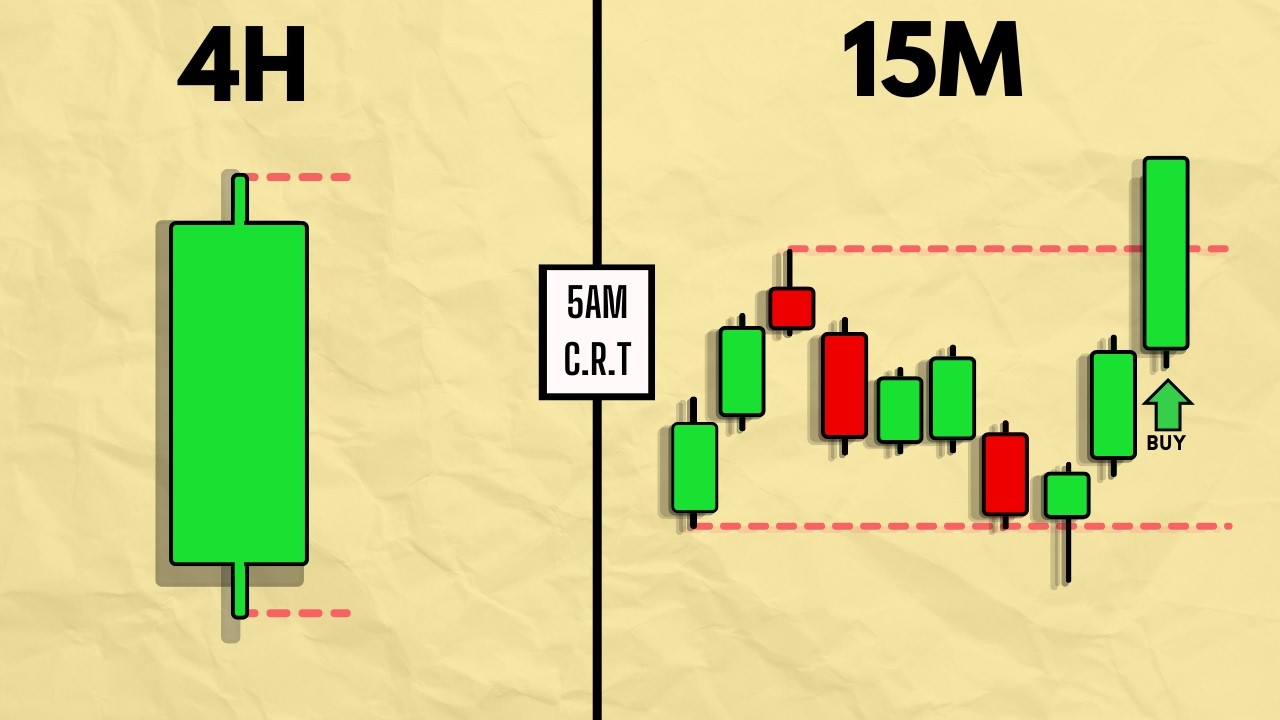
  • 🌐 The theory suggests that a candle's range can be broken down into three scenarios: one, two, or three candle formations, each representing different market behaviors.
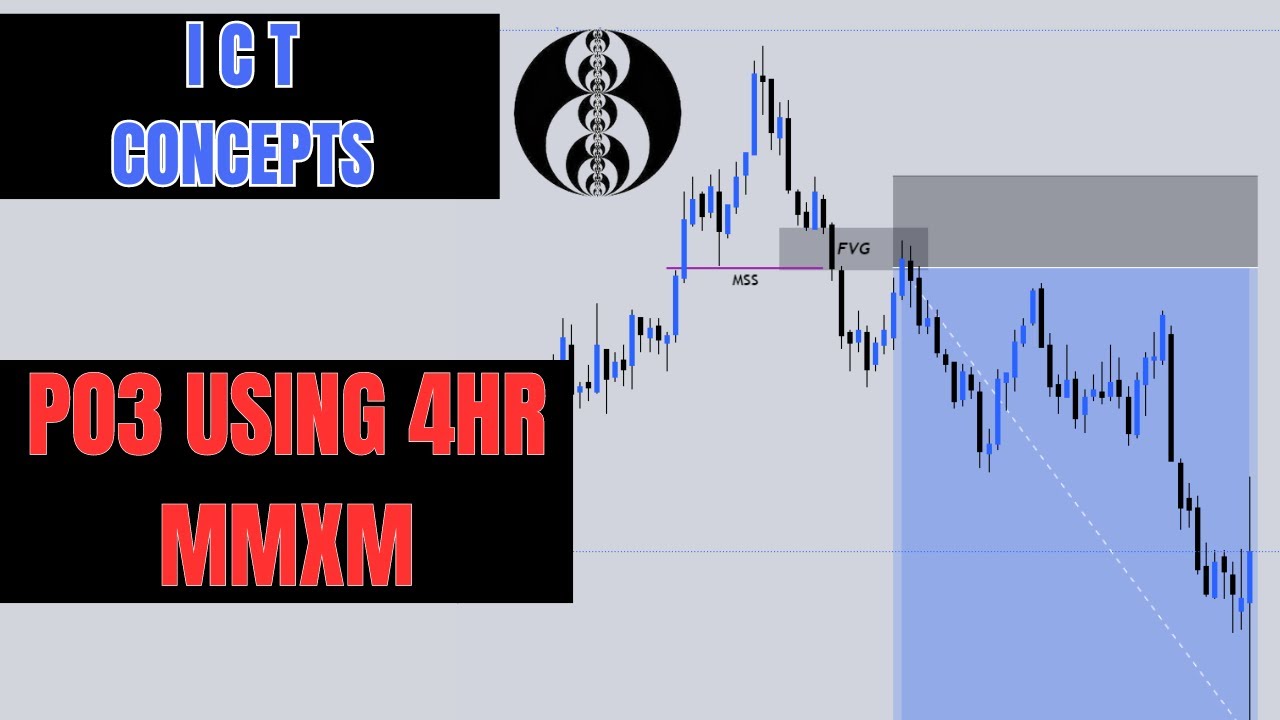
  • 📉 The 'Power of Three' concept is explained through the Accumulation, Manipulation, and Distribution (AMD) model, which helps in identifying trading opportunities.
  • 📍 Key levels or points of interest are crucial when applying the candle range theory to ensure trades have a high probability of success.
  • 📈 The video provides practical examples of how to spot candle range formations and how they align with market sessions like the Asian, London, and New York sessions.
  • 📝 The presenter shares insights on how to blend the candle range theory with the Kill Zone strategy for better trading outcomes.
  • 🔗 The video concludes by emphasizing the need for confirmation and a key level when applying the candle range theory to trading decisions.

Q & A

  • What is the main topic of Solomon King's video?

    -The main topic of Solomon King's video is the concept of Candle Range Theory, which he aims to explain in a way that is understandable to all viewers.

  • Why is Candle Range Theory important for traders according to the video?

    -Candle Range Theory is important for traders because it helps them interpret price movements and identify high and low probabilities of candle ranges, which are crucial for making informed trading decisions.

  • What is the significance of the daily candle in the context of Candle Range Theory?

    -The daily candle represents the entire transaction that happened in a 24-hour period, encapsulating the overall bullish or bearish sentiment for a particular currency pair within that timeframe.

  • How does Solomon King relate Candle Range Theory to the Power of Three concept?

    -Solomon King suggests that Candle Range Theory is essentially a rebranded version of the Power of Three concept, as both involve understanding the dynamics of price movement within a candle's range.

  • What are the three scenarios in which Candle Range Theory can be observed?

    -The three scenarios in which Candle Range Theory can be observed are: 1) within a single candle, 2) in two-candle price action, and 3) in three-candle price action.

  • What does the acronym 'AMD' stand for in the context of the video?

    -In the context of the video, 'AMD' stands for Accumulation, Manipulation, and Distribution, which are stages in the price action that can be identified within the Candle Range Theory.

  • Why is it important for the Candle Range Theory to align with a key level?

    -Aligning the Candle Range Theory with a key level is important because it helps traders identify high-probability trading areas where price is likely to react or reverse, increasing the chances of successful trades.

  • How does Solomon King demonstrate the practical application of Candle Range Theory?

    -Solomon King demonstrates the practical application of Candle Range Theory by analyzing charts and showing how price movements align with the theory's principles, especially in relation to key levels and market sessions.

  • What role do market sessions play in the Candle Range Theory according to the video?

    -Market sessions play a role in Candle Range Theory by providing specific timeframes, such as Asian, London, and New York sessions, where different stages of Accumulation, Manipulation, and Distribution can occur within a day's trading.

  • What is the advice given by Solomon King for traders using Candle Range Theory?

    -Solomon King advises traders to ensure that the Candle Range Theory formations align with their trading concept and strategy, and to look for confirmations before taking trades based on the theory.

Outlines

00:00

🕯️ Introduction to Candle Range Theory

In this paragraph, Solomon King introduces the topic of Candle Range Theory, explaining that it's a concept frequently requested by his audience. He emphasizes the importance of understanding this theory, not just in theory but also in practical trading on charts. Solomon sets the goal of the video: to explain what candle range is, its significance for traders, and how to identify high and low probability candle ranges that align with specific trading strategies.

05:02

📈 The Power of Three in Candle Range Theory

This section discusses the concept of accumulation, manipulation, and distribution (AMD) in Candle Range Theory, also known as the Power of Three. Solomon explains that Candle Range can be seen in one, two, or three candlestick price actions. He describes how a single candlestick can encapsulate a complete trading scenario, showing price movements such as accumulation, liquidity sweeps, and distribution within a trading day. This paragraph sets the stage for identifying different patterns within the Candle Range Theory.

10:04

🧭 Key Levels and Alignment in Candle Range Theory

Solomon emphasizes the importance of aligning Candle Range Theory formations with key levels or points of interest, such as order blocks or fair value gaps. He explains that trading the theory effectively requires identifying these levels, as they dictate the potential success of trades based on Candle Range patterns. He provides practical examples, showing how price actions like sweeping liquidity and shifting market structures play out in real trading scenarios, reinforcing the theory's application and effectiveness.

15:06

🌐 Candle Range Theory in Daily Trading Sessions

In this paragraph, Solomon explores how Candle Range Theory applies to different trading sessions throughout the day, particularly the Asian session, which often forms the initial range. He describes how subsequent sessions, like London and New York, involve liquidity sweeps and distribution phases, aligning with the theory's principles. This segment emphasizes the repetitive and predictable nature of these patterns across different timeframes and trading sessions, making it a valuable tool for traders seeking consistent strategies.

Mindmap

Keywords

💡Candle Range Theory

Candle Range Theory refers to the concept that each candlestick in trading represents a range of price movement within a given time frame. In the video, Solomon King explains that the theory is essential for understanding market behavior, emphasizing that without understanding how to interpret these ranges on charts, the theory is useless. The concept is described as rebranded from existing theories and is key to identifying market trends.

💡Power of Three

The Power of Three is a market concept that breaks down the price movement into three phases: accumulation, manipulation, and distribution. This concept is central to understanding the Candle Range Theory, as it is presented as a rebranding of the Power of Three. Solomon King mentions that the phases occur in different time frames, aligning with market sessions like the London and Asian markets.

💡High and Low of the Day

The 'High and Low of the Day' refers to the highest and lowest prices a trading asset reaches within a 24-hour period. According to Solomon King, knowing how to identify these levels is crucial for executing trades. He connects this with Killzone strategies, where specific market times, like the London Killzone, have a higher probability of determining the day's high or low.

💡Killzone Strategy

Killzone Strategy is a trading method where traders focus on specific market sessions, like the London or New York sessions, to capitalize on market volatility. In the video, Solomon King highlights that these time zones, particularly the London Killzone, are where traders can often spot the high or low of the day, which aligns with Candle Range Theory and the Power of Three concepts.

💡Liquidity

Liquidity in trading refers to the availability of assets to be bought or sold without causing significant price changes. In the context of Candle Range Theory, Solomon King discusses how liquidity gets swept as part of market manipulation, before the price moves to new highs or lows. This is a crucial part of spotting high-probability trades.

💡Market Structure

Market structure refers to the overall organization of price movement, including trends and patterns that indicate whether the market is in an uptrend, downtrend, or consolidation. In the video, Solomon King describes how shifts in market structure, such as breaking a previous high or low, are critical for applying Candle Range Theory effectively.

💡Order Block

An Order Block is a specific area on a price chart where large orders from institutions are placed, often indicating strong support or resistance levels. Solomon King emphasizes the importance of identifying order blocks when applying Candle Range Theory, as these areas often serve as key levels where price reversals or significant movements occur.

💡Fair Value Gap

A Fair Value Gap refers to a price gap that occurs when there is an imbalance between buying and selling, leaving unfilled orders in the market. In the video, Solomon King points out that identifying fair value gaps is essential for determining high-probability trading opportunities, as price often returns to these gaps before making significant moves.

💡Accumulation, Manipulation, Distribution (AMD)

The AMD concept represents the three phases of price movement: Accumulation (sideways market activity), Manipulation (price breakouts or false moves), and Distribution (price moves in the intended direction). Solomon King explains that Candle Range Theory incorporates these phases to help traders understand and predict market movements.

💡Key Levels

Key Levels in trading are important price points, such as previous highs, lows, or significant support and resistance areas, where price action is likely to react. Solomon King stresses that aligning Candle Range Theory with key levels is vital for successful trades, as these levels often dictate where the price will reverse or continue.

Highlights

Introduction to candle range theory and its significance for traders, emphasizing practical application on trading charts.

Explanation that a candle represents the price range within a specific timeframe, such as a daily candle covering 24 hours.

Introduction of timeframes and how lower timeframes reveal detailed price movements within larger candles.

Comparison of candle range theory with the power of three concept, stating they are essentially the same.

Three scenarios of candle range theory: single candle, two-candle price action, and three-candle price action.

Explanation of how to break down a candle into its components: open, high, low, and close, and their significance in trading.

Focus on key levels, including order blocks and fair value gaps, as important areas where candle range theory becomes relevant.

Practical example of price action using a daily candle from the gold chart to demonstrate candle range theory in action.

Key point that candle range theory aligns with higher-probability trades when it coincides with points of interest like order blocks.

The importance of sweeping liquidity, identifying key price movements that trigger shifts in market structure.

Demonstration of how price often respects fair value gaps and other key levels, and how this concept aids in trade planning.

Insight into how the Asian session often forms a range, and subsequent sessions manipulate or distribute price.

Detailed breakdown of accumulation, manipulation, and distribution (AMD) formation within a single candle and its trade implications.

Candle range theory's ability to highlight previous day highs and lows, helping traders identify draw on liquidity.

Final advice: Align candle range theory with key levels for high-probability trades, especially after sweeping liquidity.

Transcripts

play00:00

hello folks welcome back to the channel

play00:02

it's Solomon King here and in today's

play00:04

video I'll be covering the concept of

play00:08

candle wrench Theory this is something I

play00:12

have gotten request from so many people

play00:16

asking me to make this video and I feel

play00:18

like let me go ahead and explain it in a

play00:20

broader way so that every one of you

play00:23

would be able to understand what exactly

play00:26

is candle wrench Theory so my goal in

play00:28

this video is to basically give you an

play00:31

idea of what exactly is candle range how

play00:35

important it is for you as a Trader

play00:38

because that is the consummation of it

play00:39

all if you will not be able to interpret

play00:41

it on your chat there is no need for

play00:44

knowing the theory I can just make the

play00:46

video for Content sake but if you cannot

play00:49

bring it into reality on your charts

play00:52

then it's of no use then the last thing

play00:55

is that I will talk to you

play00:57

about how to spot a high probability

play01:01

candle range and then low probability

play01:03

candle range of course you will not be

play01:05

trading every candle range you need the

play01:08

ones that properly align with your

play01:11

trading concept and strategy and that is

play01:13

why we are trading in this industry if

play01:17

we cannot take trades that will give us

play01:19

good results then we are basically

play01:22

wasting our time so this concept

play01:24

recently got popularity on the internet

play01:28

especially Trading in space and even

play01:32

though this is a concept that even a new

play01:34

be is aware of uh the name and the title

play01:38

whatever was given to it was just a

play01:41

rebranding all right so in simple term

play01:44

whenever people talk about candle range

play01:47

Theory what they are basically saying is

play01:49

that a candle is simply a range all

play01:54

right a candle is simply a range and

play01:58

that brings us to the idea year of time

play02:01

frame so this is a daily candle let me

play02:04

start by that and what this is saying is

play02:07

that the entire transaction that

play02:09

happened in this day that is 24 hours

play02:12

right is represented in this

play02:16

candle one Candlestick and let's assume

play02:19

this is a bullish candle that means the

play02:22

entire transactions that happened in the

play02:26

last 24

play02:28

hours was bullish in simple term if that

play02:32

particular currency PA GBP USD for

play02:35

example is represented here that means

play02:39

GBP has been strong throughout the 24

play02:44

hours throughout the last 24 hours and

play02:48

that is the receipt now if we break down

play02:51

this guy into the lower time frame this

play02:55

is the 15minute time frame right we're

play02:58

going to see the entire price move

play02:59

movement in such a way all right price

play03:02

had a break off structure break off

play03:05

structure even a shifting Market

play03:07

structure everything that happened that

play03:11

was represented within this daily candle

play03:14

is captured

play03:17

here all right so what this is basically

play03:20

saying is that a Candlestick is simply a

play03:25

range that means it has the low or where

play03:30

we saw this and the high the highest

play03:34

level that that candle went to that is

play03:37

why whenever we are taking a trade in a

play03:39

day we have where the low of the day or

play03:41

the high of the day is formed and we

play03:46

know how to trade it accordingly

play03:49

especially for example if you have

play03:51

followed my videos on the Killzone

play03:53

strategies you will know that the London

play03:55

Killzone has the highest probability of

play03:57

creating either the high of the day or

play04:00

the law of the day according to ICT now

play04:04

this same candle wrange theory is the

play04:09

rebranded or another name given to our

play04:14

popular power of threee

play04:17

Concepts because everything that is

play04:19

covered in the candle wrench theory is

play04:22

captured in the power of three concepts

play04:24

as a matter of fact I have watched a lot

play04:27

of ICT videos and and I have personally

play04:30

traded ICT concepts for a while but I've

play04:34

never really really had ICT mentioned

play04:36

about the candle range Theory I don't

play04:38

know if I am wrong you can correct me

play04:40

but then what ICT thought is the power

play04:43

of three concepts is the same thing I

play04:47

hope you understand this so how can we

play04:50

really spot it the reality of it now

play04:53

there are three scenarios of this candle

play04:57

wrench Theory which I want to show you

play04:59

please pay attention to it in detail

play05:01

look at these three different scenarios

play05:05

I hope you can remember your

play05:07

accumulation manipulation and

play05:09

distribution this is a popular concept

play05:12

where we have the AMD formation now

play05:15

there are three different scenarios that

play05:18

a power of tree can be formed or the

play05:22

candle wrench concept can be formed we

play05:26

can find candle wrange Concept in one

play05:30

single

play05:31

candle all right in one single candle we

play05:35

can find it in two candle price action

play05:39

and we can find it in three candle price

play05:42

action let me give you a very simple

play05:45

scenario I will go to my chart don't

play05:47

worry we're going to do practicals we're

play05:49

going to spot it and how important it is

play05:52

for our trading as a general so look at

play05:56

this the first

play05:57

concept price start

play06:00

started this is the lowest area but this

play06:04

is the open for this bullish candle

play06:06

price opens boom it

play06:09

ranged then it went

play06:13

lower then it went

play06:16

higher all right and then it came back

play06:20

and

play06:22

closed at this

play06:24

point are you now seeing what I'm saying

play06:27

the candle range Theory let me adjust

play06:29

this one so if you break down this

play06:34

candle you have price

play06:40

accumulating then sweeping the liquidity

play06:43

below here if you break it down in the

play06:46

lower time frame right and boom it went

play06:50

High creating the highest level leing

play06:54

area of liquidity here money and it

play06:58

closed right here

play07:00

the open the low the

play07:05

high this is one Candlestick CRT which

play07:09

is the candle range

play07:11

Theory you can find it on one

play07:14

Candlestick just like this example you

play07:17

see price opened from here all right it

play07:22

moved High to that area after sweeping

play07:26

liquidity because this is mostly a range

play07:30

and boom it went

play07:32

high and closed around

play07:35

here if you break it down to the time of

play07:38

the day this is the

play07:40

popular power of threee concept for one

play07:44

Candlestick of a day it starts from a

play07:47

range within the Asia this is why the

play07:50

Asian time is mostly known as a range

play07:54

let me give you a proper delineation of

play07:56

what I'm trying to explain so if you

play07:59

Asian time starts as a range and

play08:03

manipulation comes

play08:04

in after the Asia has

play08:09

closed this is why I said a

play08:13

Candlestick can be seen in this simple

play08:16

format and then distribution comes

play08:20

in distribution comes in during

play08:25

word London SL New York so Asia comes as

play08:30

a range let's have it here let's have it

play08:34

Asia comes as a

play08:37

range and

play08:40

London comes with the manipulation which

play08:43

is creating the low of the day you

play08:48

remember the low of the day and

play08:51

distribution then the close of that day

play08:55

what is it called the candle range

play08:58

Theory candle do is arrange the entire

play09:01

price movement you can delineate don't

play09:04

worry you will have every single detail

play09:06

properly given to you in this video so

play09:09

sweeping liquidity and it went up so in

play09:12

this

play09:13

same understanding we can also watch

play09:17

other candle range formation that is not

play09:22

only one

play09:23

Candlestick all right the second type is

play09:27

this one where price

play09:29

went above the previous Day candle

play09:34

clearing the high or the low in

play09:38

different scenarios now if we are going

play09:40

if we actually on a bullish scenario

play09:42

clearing the high of that and then

play09:45

targeting the drawn liquidity

play09:48

below clearing the

play09:50

high targeting the drawn liquidity

play09:53

below all right I will talk to you about

play09:58

how to spot the most important one

play10:00

because we need key levels that this

play10:04

will play out with properly we need key

play10:07

levels that this will play out with

play10:09

properly what I mean by key level is

play10:11

basically your point of interest when I

play10:13

go for the practicals you're going to

play10:14

see it so right here you have this one

play10:19

the to scenario is when price plays the

play10:22

same and it Contin downward to Target

play10:27

the draw liquidity you can do this same

play10:29

tempting for a bullish scenario so these

play10:31

are the three types or the three ways we

play10:35

can sport candle range Theory all right

play10:38

candle range Theory so how important it

play10:40

is the candle range Theory formation

play10:44

must align with your point of interest

play10:47

if price is sweeping liquidity and

play10:49

trading into for instance an order block

play10:53

by this site or a feir value Gap then

play10:57

this concept will play out perf L

play11:00

because we are going above this sweeping

play11:02

liquidity hitting the point of

play11:06

Interest all

play11:07

right and then we have a shifting Market

play11:11

structure then we take it for the

play11:13

bearish movement let me go to my chart

play11:15

and show you because I don't want to do

play11:17

too much of theoretical part of this

play11:19

let's go to the Chart all right so this

play11:22

is a practical example of what I was

play11:24

showing you now look at this particular

play11:27

scenario all right

play11:30

price traded

play11:33

below the low of this daily candle this

play11:36

is gold the daily candle price have

play11:39

traded below the low of this candle

play11:42

which is where the liquidity is

play11:45

resting and after that we saw price

play11:48

going above pushing upward what area did

play11:52

we locate this bullish order Block

play11:56

Please take note of how price is

play12:00

trading and

play12:01

respecting this

play12:04

concept so that particular bullish order

play12:07

block is where price traded into and

play12:12

quickly moved up this

play12:15

is the second type I showed you price

play12:19

pressing below the low before going to

play12:22

the opposite direction this is it again

play12:24

look at this one we have

play12:27

this price clearing the liquidity above

play12:32

trading into this area rejection block

play12:36

boom and what

play12:38

happened quickly moving in the opposite

play12:41

direction the same thing

play12:44

here the same thing here moving in the

play12:48

opposite direction

play12:51

boom moving in the opposite direction

play12:54

now if you go through your chart whether

play12:57

in the daily time frame in the 4our time

play13:00

frame you're going to see this happening

play13:02

time and again and again candle range

play13:05

Theory

play13:07

clearing this highs trading into this

play13:10

area before crashing

play13:13

down you see oh this one has not reached

play13:16

that point of interest but then it's

play13:18

something that if you go through your

play13:20

chart you're going to see it time and

play13:21

again and again you see the T type of or

play13:25

the T scenario where you have three

play13:27

candles you see these ones price going

play13:31

above the previous day high and then

play13:35

targeting the low all this draw on

play13:38

liquidity starting from the internal

play13:40

draw on liquidity and finally

play13:44

reaching to that area so candle range

play13:47

theory is

play13:49

basically those of you that are trading

play13:51

previous day high previous day low and

play13:55

then that concept is what has been

play13:57

rebranded to the candle range Theory

play14:00

concept but it must be aligning with a

play14:05

very important or it must be aligning

play14:08

with a key level all right look at this

play14:12

one price have

play14:15

this the body of the candle look at

play14:19

this this

play14:21

Candlestick pushing into where the fair

play14:25

value gap which is the point of Interest

play14:29

and price went from there so those of

play14:32

you who are trading the previous Day

play14:34

candle high if you sweep the previous

play14:36

Day candle high or you sweep the

play14:37

previous Day candle low you target a

play14:40

point this is the same concept you know

play14:43

price going above it and then crashing

play14:46

downward so when you spot these things

play14:49

they can be aligned in such a way that

play14:52

you can use it for trading so now let's

play14:55

talk about how we can align this with

play14:57

the times of the day

play15:00

with the times of the day all right is

play15:02

very very important now let's look at

play15:05

this particular scenario this is the

play15:08

candle range theory for a day the one I

play15:10

told you about the AMD I used to use

play15:13

this indicator for trading this same

play15:15

concept of candle range Theory now you

play15:18

can divide it into sessions where we

play15:22

have the Asian station the Asian station

play15:24

is basically formed like a range for the

play15:28

day this is the range the high and the

play15:32

low and what do we look out for if we

play15:36

come to the next session we basically

play15:38

look out for the sweep of liquidity that

play15:41

is resting above or below it which is

play15:45

popularly known as the

play15:47

manipulation and the

play15:50

distribution it's a simple concept that

play15:53

repeats itself often times and you can

play15:56

see it on your chart you can literally

play15:59

spotted without any stress all right the

play16:03

candle range Theory formation here you

play16:05

can see it happened right here price

play16:09

targeting the LW of Asia this one is

play16:12

simply for the day and what did we see

play16:16

boom it went up to that area now this is

play16:20

the same scenario we are seeing so this

play16:23

same scenario if you bring it in a

play16:25

Candlestick formation you will see it

play16:27

something like this the candle body and

play16:31

this is the

play16:33

high this is the low manipulation all

play16:36

right the open and then it ranged it

play16:40

went below to sweep liquidity below just

play16:44

a little bit and then boom it closed as

play16:46

a bullish candle this happens many times

play16:49

of the day you see price have

play16:53

accumulation manipulation and it

play16:55

distributed to this side all right so

play16:58

you see this happening time and again

play17:01

and again the power of three concept is

play17:04

the same thing as the candle range

play17:07

Theory you have price sweeping the

play17:10

liquidity going into a key level and

play17:14

then trading either to the next

play17:16

direction to distribute or giving you a

play17:20

perfect thread entry so always look for

play17:22

a confirmation in

play17:25

conclusion when you have your candle

play17:27

range let's say this is the

play17:30

range and you trade into either a fair

play17:34

value Gap or a key level a key level

play17:37

must always be there a key level whether

play17:40

you're looking at it from the 4our time

play17:42

frame or from any time frame the key

play17:46

level is to basically help you know

play17:48

whether that particular area is a high

play17:51

probability area Because by the time you

play17:53

sweep either the high of that candle or

play17:56

the low of the candle if you don't have

play17:58

any key level level that will be

play18:01

important for price to bounce back from

play18:04

it is going to be futile price is going

play18:06

to go up so whenever you have price

play18:08

trading and sweeping liquidity above or

play18:10

below the previous day high into a key

play18:13

level or a point of interest and having

play18:16

a shifting structure you can easily take

play18:18

the trade from there and that is my

play18:21

basic understanding of the candle range

play18:23

Theory nothing more nothing less if you

play18:25

can use this and blend it with your Kill

play18:28

Zone strategy power of threee is almost

play18:31

the same thing all right thank you very

play18:33

much guys I just tried to share with you

play18:35

and show you what exactly it is see you

play18:37

in my next video

Rate This

5.0 / 5 (0 votes)

Etiquetas Relacionadas
Trading StrategiesCandle RangeForex TradingMarket AnalysisTechnical AnalysisPrice ActionTrader EducationPower of ThreeICT ConceptsLiquidity Sweep
¿Necesitas un resumen en inglés?