Forecasting with Excel

Anand S
17 Jun 202411:32

Summary

TLDRThis script explores Excel's 'Forecast' function, which performs linear regression to predict future values. Using a height and weight dataset, the tutorial demonstrates converting units to metric, plotting data, and applying the function to estimate weights for given heights. It compares 'Forecast' and 'Trend' functions and highlights their limitations with non-linear data, such as traffic patterns. The script suggests 'Forecast.ETS' for cyclical data, illustrating its application with a traffic dataset to show improved predictions over linear methods.

Takeaways

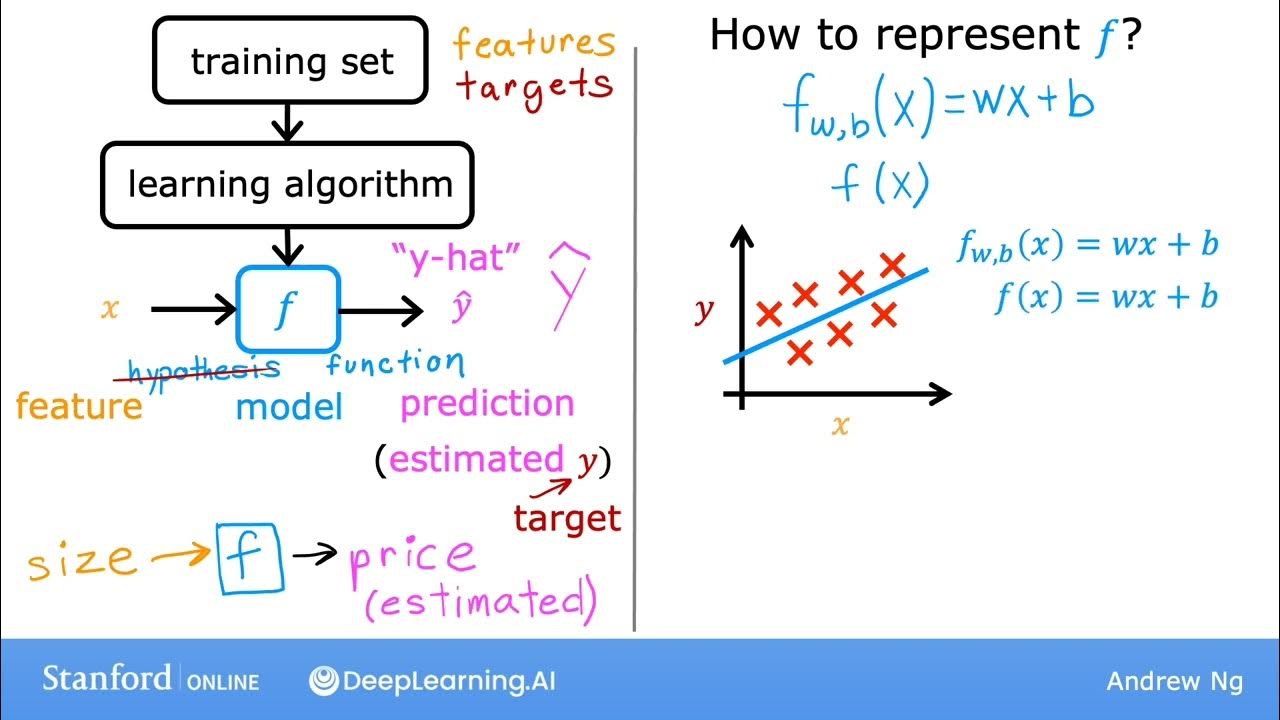
  • 📊 The 'FORECAST' function in Excel performs a linear regression to predict future values based on existing data trends.
  • 📈 'FORECAST.LINEAR' is a synonym for 'FORECAST' and they both use the same linear regression method for predictions.
  • 📈 The script uses a height and weight dataset from Google to demonstrate the 'FORECAST' function, converting units from inches and pounds to metric for easier understanding.
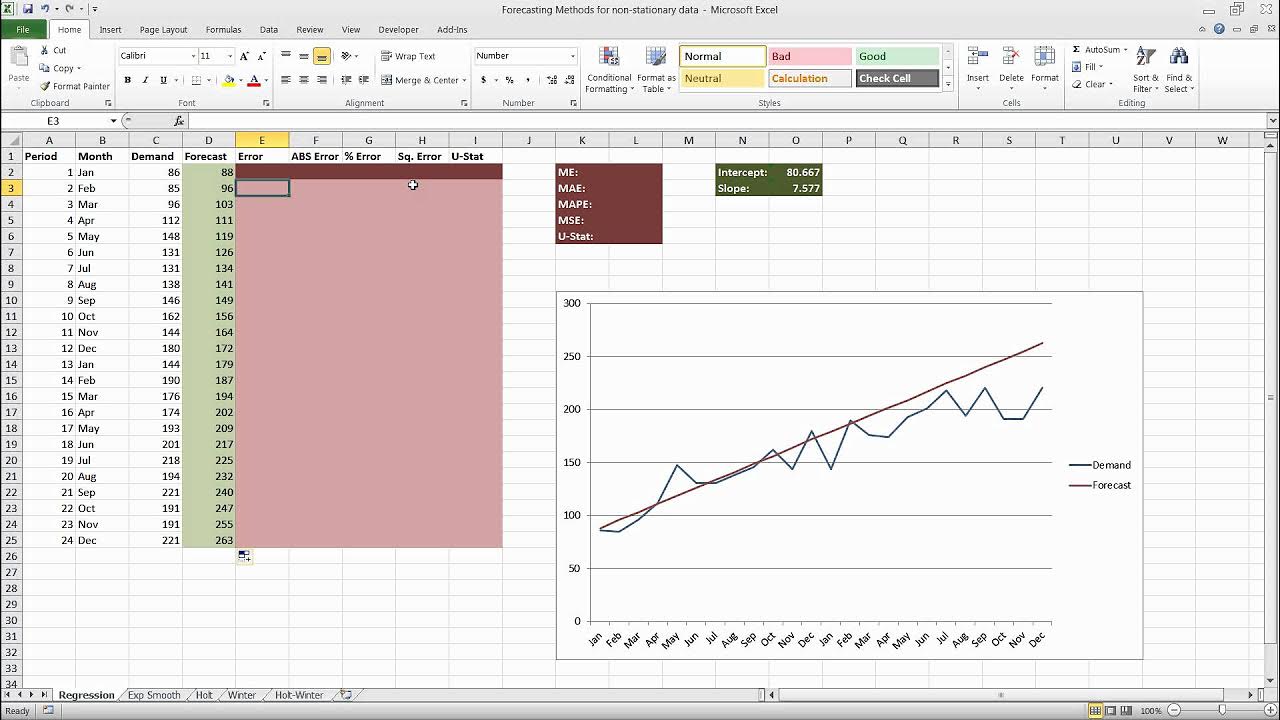
  • 📊 To visualize the data, a scatter plot is used to show the relationship between height and weight, indicating a roughly linear increase in weight with height.
  • 🔢 The 'FORECAST' function requires known Y values (dependent variable) and known X values (independent variable) to make predictions.
  • 🤔 The script highlights the limitations of linear regression when dealing with data that has seasonal patterns, such as traffic data, which shows spikes and trends that a linear model cannot accurately predict.
  • 📉 The 'TREND' function is introduced as an alternative to 'FORECAST', which can handle arrays of X values for predictions, but it also suffers from the same limitations with non-linear data.
  • 🔄 The script points out that 'FORECAST', 'FORECAST.LINEAR', and 'TREND' functions are also available in Google Sheets, allowing for easy data manipulation across platforms.
  • 🔄 The 'FORECAST.ETS' function is introduced for handling cyclical data, allowing for the inclusion of seasonality in predictions, which is more suitable for data with patterns that repeat over regular intervals.
  • 📅 'FORECAST.ETS' requires specifying the seasonality period, or it will attempt to determine it automatically, and can handle missing values by interpolation or by setting them to zero.
  • 📈 The script concludes that for non-linear and seasonal data, 'FORECAST.ETS' provides better predictions than simple linear regression, although it's not as advanced as some specialized forecasting tools.

Q & A

  • What does the Excel function 'FORECAST' do?

    -The 'FORECAST' function in Excel performs a linear regression analysis on a dataset and uses the resulting model to predict future values based on the trend of the input data.

  • What is the synonym for the 'FORECAST' function in Excel?

    -The 'FORECAST.LINEAR' function is a synonym for the 'FORECAST' function, and they perform the same linear regression analysis for prediction purposes.

  • What type of data set is used in the script to demonstrate the 'FORECAST' function?

    -The script uses a height and weight dataset from Google, containing measurements for about 25,000 people in inches and pounds, which is then converted to centimeters and kilograms.

  • How is height converted from inches to centimeters in the script?

    -To convert height from inches to centimeters, the height in inches is multiplied by 2.54.

  • What is the approximate formula used to convert weight from pounds to kilograms in the script?

    -The script uses a formula where weight in pounds is divided by approximately 2.204 to convert it to kilograms.

  • How does the script visualize the relationship between height and weight?

    -The script visualizes the relationship between height and weight using a scatter plot, which shows how weight varies with height.

  • What is the predicted weight for a person who is 170 cm tall according to the 'FORECAST' function in the script?

    -According to the 'FORECAST' function in the script, a person who is 170 cm tall is predicted to weigh about 56 kg.

  • How does the 'TREND' function in Excel differ from the 'FORECAST' function?

    -The 'TREND' function is similar to 'FORECAST' in that it also performs linear regression, but it can be used to predict multiple future values at once by passing an array of new X values.

  • Why might a linear regression model not be suitable for all types of data?

    -A linear regression model might not be suitable for data that exhibits non-linear patterns or seasonality, as it assumes a straight-line relationship between variables.

  • What is the 'forecast.ETS' function in Excel, and when is it more appropriate to use than 'FORECAST'?

    -The 'forecast.ETS' function in Excel is used for time series data that has a seasonal pattern. It is more appropriate to use when the data shows cyclical behavior, as it can better capture the seasonality compared to a simple linear model.

  • How does the 'forecast.ETS' function handle seasonality in data?

    -The 'forecast.ETS' function can explicitly specify seasonality through a parameter, or it can automatically detect the seasonality in the data. It then uses this information to make predictions that account for the seasonal fluctuations.

Outlines

00:00

📊 Excel Forecast Function and Linear Regression

This paragraph introduces the Excel 'Forecast' function, which performs a linear regression to predict future values based on existing data. The example uses a dataset of heights and weights from Google, converting from inches and pounds to centimeters and kilograms, respectively. The author demonstrates how to use the function to predict a person's weight based on their height and vice versa. The paragraph also explains that 'Forecast' and 'Forecast.Linear' are synonymous and that the function can be applied to an array of values for more efficient predictions, as opposed to running the formula independently for each value.

05:02

📈 Comparing Forecast Functions in Excel

The second paragraph delves into the limitations of linear regression for non-linear data, using traffic data as a counterexample. The author shows how the 'Trend' function in Excel can be used similarly to 'Forecast' but fails initially due to an incorrect formula range. After correcting the range, the 'Trend' function successfully predicts values across a range of X values. The paragraph also touches on the 'Forecast.ETS' function, which is better suited for cyclical data, and demonstrates its use with optional parameters for seasonality and data completion. The author compares the effectiveness of linear forecasting, 'Trend', and 'Forecast.ETS' by plotting them against actual traffic data.

10:02

🚦 Evaluating Forecast Accuracy with Traffic Data

In the final paragraph, the author evaluates the accuracy of the 'Forecast.ETS' function by plotting it alongside actual vehicle counts and a linear prediction. The 'Forecast.ETS' function is shown to perform better than a simple linear forecast, especially during peak traffic times, although it still has some inaccuracies. The author emphasizes that while 'Forecast.ETS' is an improvement for cyclical data, it is not as advanced as other forecasting tools but is a significant step up from linear regression.

Mindmap

Keywords

💡Forecast Function

The 'Forecast Function' in Excel is a tool that performs a linear regression analysis to predict future values based on existing data. It is central to the video's theme of data analysis and prediction. The script uses the 'Forecast Function' to predict a person's weight based on their height, demonstrating its application in a real-world context.

💡Linear Regression

Linear Regression is a statistical method used to model the relationship between a dependent variable and one or more independent variables by fitting a linear equation. In the video, linear regression is the underlying mechanism of the 'Forecast Function', which is used to predict values such as weight based on height.

💡Data Set

A 'Data Set' is a collection of data points, often used for analysis and modeling. The script refers to a specific 'Heights and Weights' data set from Google, which contains information on thousands of people, illustrating the use of data sets in statistical analysis.

💡Metric System

The 'Metric System' is an internationally recognized decimal system of measurement. The video script mentions converting height from inches to centimeters and weight from pounds to kilograms, which are both part of the metric system, to facilitate analysis and comparison across different units of measurement.

💡Scatter Plot

A 'Scatter Plot' is a type of graph that displays the values of two variables for a set of data. The script describes using a scatter plot to visualize the relationship between height and weight, helping to understand the correlation between these two variables.

💡Trend

The 'Trend' in the context of the video refers to a general direction in which something is developing or changing. The 'Trend' function in Excel is similar to 'Forecast' and is used to predict future values based on existing data trends, as demonstrated when predicting a person's height based on their weight.

💡Array Formula

An 'Array Formula' is a formula in Excel that performs a calculation on a range of values. The script discusses using an array formula to apply the 'Forecast' function to multiple values at once, showcasing a more efficient way to handle large data sets.

💡Seasonality

Seasonality refers to the predictable and recurring fluctuations that occur within a market or a set of data due to seasonal changes. The video script mentions using 'Forecast.ETS' to account for seasonality in traffic data, highlighting the importance of considering seasonal patterns in predictive modeling.

💡Cyclical Data

Cyclical Data are data points that follow a repeating pattern over time. The video script uses the example of traffic data, which has a weekly cycle of high and low traffic, to illustrate the need for specialized forecasting methods like 'Forecast.ETS' to handle cyclical patterns.

💡Interpolation

Interpolation is a method of estimating unknown values between two known points in a data set. The script briefly mentions interpolation as an option in the 'Forecast.ETS' function, which can be used to fill in missing data points by estimating their values based on surrounding data.

Highlights

The forecast function in Excel performs a linear regression to predict future values based on existing data.

The forecast function is synonymous with the forecast.linear function in Excel.

A dataset of 25,000 people's heights and weights from Google is used for demonstration, with a sample of 1,000 rows.

The dataset is converted from inches and pounds to centimeters and kilograms for metric consistency.

A scatter plot is used to visualize the relationship between height and weight.

The forecast function predicts a person's weight based on their height using the known dataset.

The trend function in Excel can be used for an array of values, providing a more efficient method than individual forecasts.

The transcript demonstrates how to use the trend function with an array formula for multiple predictions.

The forecast.ETS function is introduced for handling cyclical data, such as traffic patterns.

Forecast.ETS allows specifying seasonality and can automatically detect it if not provided.

The transcript compares linear forecasting with forecast.ETS for traffic data, showing the latter's superiority.

The importance of selecting the right forecasting method for different types of data is emphasized.

The transcript illustrates the process of plotting predictions alongside actual data for visual comparison.

Excel's forecast functions are available in Google Sheets, allowing for easy data transfer and manipulation.

The limitations of linear regression for certain datasets, such as traffic data with seasonal patterns, are discussed.

The transcript provides a step-by-step guide on converting imperial measurements to metric for data analysis.

The practical application of Excel's forecasting functions in real-world scenarios, such as predicting traffic flow, is explored.

The transcript concludes by highlighting the need for advanced forecasting tools for more accurate predictions in complex datasets.

Transcripts

play00:00

we're going to explore the forecast

play00:03

function in Excel what the forecast

play00:05

function does is a linear regression

play00:08

behind the scenes and then uses that to

play00:10

predict what the next value or a new

play00:13

value is going to be uh a synonym for

play00:16

this is forecast. linear they are

play00:18

exactly the same thing to do this I'm

play00:21

going to take a data set specifically a

play00:23

Heights and weights data set from gagle

play00:26

what this provides is for several people

play00:28

for about 25,000 people their height in

play00:31

inches and their weight in pounds I'm

play00:34

going to take the same data set except

play00:36

that I'm not going to use the full data

play00:38

set I'm only going to use a sample

play00:40

because I would just want to illustrate

play00:41

the point in our sample we have 1,000

play00:45

rows and for each of these we have the

play00:47

height and weight in inches and pounds U

play00:50

I'm not very familiar with the inch and

play00:53

pound system so I'm going to convert

play00:55

this to metric specifically I'm going to

play00:57

convert the height to CM and and the

play01:00

weight to kg to convert the height to

play01:03

centimet I would take the height in

play01:05

inches and multiply it by 2.54 to

play01:08

convert uh to kgs I don't know what the

play01:10

exact formula is U but I do have it uh

play01:14

looked up here it's yeah

play01:16

2.204 something so let me divide the

play01:21

weight in pounds by 2.204 whatever and

play01:25

drag this all the way to the end great

play01:28

so now we have all of the these values

play01:30

let me reduce the number of decimals so

play01:33

I can read it

play01:34

out all right so what this is saying is

play01:37

there's somebody who was 167 cm who

play01:40

weighed 51.3 kgs and so on now just to

play01:44

get a feel for what this looks like let

play01:46

me plot this and a way of uh doing that

play01:50

that will be intuitive is using a

play01:51

scatter plot so this scatter plot tells

play01:55

me that okay if you look at the height

play01:57

on the x-axis as the height VAR from say

play02:00

about 160 cm to about 185 CM the weight

play02:05

grows roughly from around 50 kgs to

play02:08

maybe around 65

play02:10

kgs okay that's useful to know so let's

play02:13

see if we can do an explicit forast if I

play02:17

said forecast of uh now let's see what

play02:20

the formula actually expects it's saying

play02:23

pass an x value for which we want to

play02:26

forecast so let's say we want to

play02:27

forecast for a person who who has a

play02:30

height of 170 cm the known Y in this

play02:34

case the thing that we want to forecast

play02:37

the Y is the weight so what would be the

play02:39

height of somebody who's 170 cm tall so

play02:42

I've taken all of the Y values which are

play02:44

the weights and then it's saying known

play02:46

X's which is all of the height values

play02:49

pass that and click okay that says that

play02:54

a person of height 170 cm should be

play02:57

about 56 kgs which incidently would make

play03:00

me massively overweight um now look at

play03:04

the formula again we have the height

play03:07

value that we want to predict for all of

play03:09

the weights and all of the heights we

play03:13

can flip this around I could say uh for

play03:15

forecast for a person who is let's say

play03:18

75 kgs of weight what are all the known

play03:20

Ys in other words what we now want to

play03:23

predict the height which has become the

play03:25

Y value so take all the heights pass all

play03:28

the weights as the other parameter and

play03:31

it's saying that somebody who's 75 kgs

play03:33

should be about 6 feet tall 180 cm is

play03:36

about 6 ft so that is how forecast Works

play03:41

forecast is exactly the same as

play03:43

forecast. linear what it's doing behind

play03:46

the scenes is linear regression and then

play03:49

using that linear regression coefficient

play03:51

and slope to calculate the the actual

play03:54

predicted value for whatever X we are

play03:57

targeting now supposing you want to do

play04:00

this for an array U let's say I have a

play04:03

person of height 150 somebody of height

play04:06

155 let's say this plus 5 cm and so on

play04:10

up to maybe let's see uh 6

play04:13

ft I could to and equals forecast for

play04:16

each one of these and put in the formula

play04:18

but there's a better way let let me show

play04:20

you how I do that so equals forecast of

play04:23

the x value which is this and the known

play04:27

y values which is the uh weights and the

play04:32

known X values which is the Heights and

play04:36

press enter and copy the same formula

play04:40

all the way across but this can be

play04:42

inefficient because each formula is

play04:43

running independently so what I could

play04:46

instead do is use another formula called

play04:48

Trend which is exactly the same thing uh

play04:51

except the way in which it works is I

play04:53

pass the known y values which is all of

play04:56

the weights I pass All the known X

play04:59

values which is all of the Heights and

play05:01

then I pass the new X values that is

play05:05

this set of values and here's where

play05:07

instead of passing One X value we pass a

play05:09

range of X values and press enter and

play05:13

that failed

play05:17

uh oh I think that's because I got the

play05:20

formula wrong it's D2 to d01 this should

play05:23

also be D2 to uh C2 to

play05:27

c0001 and yes now you'll notice that it

play05:30

automatically filled the entire column

play05:32

that's because it's an array formula but

play05:34

what it's doing behind the scenes is

play05:36

calculating the regression at one shot

play05:38

and then applying it for all of the Y

play05:41

all of the X values and the results are

play05:43

exactly the same both these functions

play05:46

that is forecast and forecast. linear

play05:49

which is a synonym as well as Trend are

play05:51

available in Google Sheets as well so

play05:54

you could just save this open it in

play05:56

Google Sheets make edits save it load it

play05:59

back back in Excel it works perfectly

play06:01

fine but this is a linear regression and

play06:05

it doesn't always apply for all series

play06:08

very well uh let's take an example or

play06:10

counter example if you supposing I took

play06:13

traffic data so here for different

play06:16

Junctions we have for every hour the

play06:19

number of vehicles at that Junction now

play06:22

I'm going to take a subset of this data

play06:25

and open it so this is traffic data set

play06:31

and yeah so now for each R we have the

play06:35

number of vehicles now let's plot this

play06:39

if I were to look at what the number of

play06:42

vehicles looks like over time as a line

play06:46

chart you can see that it's very spiky

play06:50

understandably because each day there is

play06:52

a peak and a truff and as the days

play06:57

progress there's also weekly pattern so

play06:59

weekends relatively low traffic uh but

play07:02

okay we also have Christmas relatively

play07:03

low traffic so that's a 3-day weekend

play07:05

probably but otherwise it's usually a

play07:06

two-day weekend middle of the we is

play07:08

relatively higher so these are seasonal

play07:10

patterns and if I tried to do a

play07:12

prediction a linear prediction it

play07:15

wouldn't be such a good fit let's in

play07:18

fact try and do that and see what we get

play07:21

so if I said equals trend of the known Y

play07:26

which are the vehicle values and the

play07:30

known X's which are the date times and

play07:33

let's put in the actual date times CS uh

play07:36

again to predict what the value will

play07:38

look like so you'll see that it's

play07:40

consistently predicting okay about 20

play07:42

Vehicles 20 Vehicles it's gently may be

play07:45

increasing up to 21 vehicles and if you

play07:48

were to plot this let's call this linear

play07:53

prediction and if we were to plot a

play07:55

comparison of these two we'll insert a

play08:00

line

play08:02

chart and that's what it looks like a

play08:04

gentle slope upward slope though I can

play08:08

barly see it but it's yeah like a clock

play08:11

that is broken it gets it right twice a

play08:14

day but that's about it to bring in a

play08:18

certain amount of seasonality we can use

play08:20

forecast. ETS that's slightly better

play08:23

than the linear prediction for cyclical

play08:26

data the way forecast. ETS works is u i

play08:31

can pick a Target date the date date

play08:34

that I want to predict for so let's say

play08:36

I put this value itself the all the Y

play08:39

values which in this case is the number

play08:41

of

play08:42

vehicles and all the X values which is

play08:45

the timeline and then there are a bunch

play08:47

of optional values which I'm going to

play08:49

ignore uh let me just put in the dollars

play08:51

here because I'm going to drag the

play08:54

formula uh but I'll just tell you what

play08:57

the other parameters are the fourth

play09:00

parameter is seasonality and if you

play09:03

specify a seasonality like let's say 24

play09:06

then it means every 24th item

play09:10

is or 24 items is the seasonality in

play09:14

this case it would be every 24 hours so

play09:16

we can explicitly specify 24 hours a

play09:18

seasonality but if we did not then it

play09:21

would guess what the seasonality is by

play09:23

itself and it would probably figure out

play09:25

that it's 24 data completion if we put

play09:28

it as one then it replaces the values

play09:32

missing values by interpolation in our

play09:34

case we don't have missing values but if

play09:35

we did then it would replace it by

play09:37

interpolation and that is the default

play09:39

and instead if you want missing values

play09:41

to be zero then you put in zero in our

play09:43

case leaving both of them at the

play09:45

defaults is perfectly fine and it

play09:47

produces a forecast now let's apply

play09:50

let's extend this forecast to the entire

play09:53

series and that has yeah filled in the

play09:57

result and now let's plot this uh ETS

play10:02

prediction alongside our number of

play10:05

vehicles prediction so we now have three

play10:07

series let's see what they look

play10:13

like okay um that's a little hard to

play10:16

read so I'll make it bigger and I'll

play10:20

also make the lines a little thinner so

play10:23

we can see it better let me click on

play10:27

each of these click on for mat and

play10:30

change the weight of this to maybe half

play10:34

a point um yeah sure the formatting and

play10:38

change the weight of this one as well to

play10:42

about half a

play10:44

point and that allows us to compare

play10:47

things a little better so the green line

play10:50

is our prediction the blue line is the

play10:53

actual you can see that the green line

play10:56

is not doing a great jum it's on this

play10:59

weekend is kind of doing an okay job uh

play11:01

but let's assume this a Sunday Monday

play11:03

yeah here's a Tuesday where the traffic

play11:05

was pretty high and it was not able to

play11:07

match that but it's doing a much much

play11:10

better job than the orange line which

play11:12

was just straight linear forecasting so

play11:15

when it comes to cyclical data you're

play11:18

better off using forecast. ETS it's not

play11:21

as good as more advanced forecasting

play11:23

tools but definitely better than

play11:25

something like linear uh linear

play11:27

regression

play11:29

now in this case the forecast.

Rate This

5.0 / 5 (0 votes)

Etiquetas Relacionadas
Excel ForecastingLinear RegressionData AnalysisSeasonal PatternsCyclical DataETS ForecastingTrend AnalysisMetric ConversionWeight Height DataTraffic Prediction
¿Necesitas un resumen en inglés?