How to Graph Lines in Slope Intercept Form (y=mx+b)
Summary
TLDRThis tutorial offers an insightful look into graphing linear functions with a focus on the slope-intercept form. The instructor clarifies that 'f(x)' and 'y' represent the same function output, simplifying the process. By identifying the slope as -3/4 and the y-intercept at +2, the lesson demonstrates how to plot the intercept and use the slope to create a descending line from left to right. The methodical approach of plotting points, moving down 3 units and to the right 4 units, builds a consistent pattern, ultimately resulting in a complete graph of the function y = -3/4x + 2. The video concludes with a reminder that 'y =' and 'f(x) =' are interchangeable, emphasizing the simplicity of graphing linear functions.
Takeaways
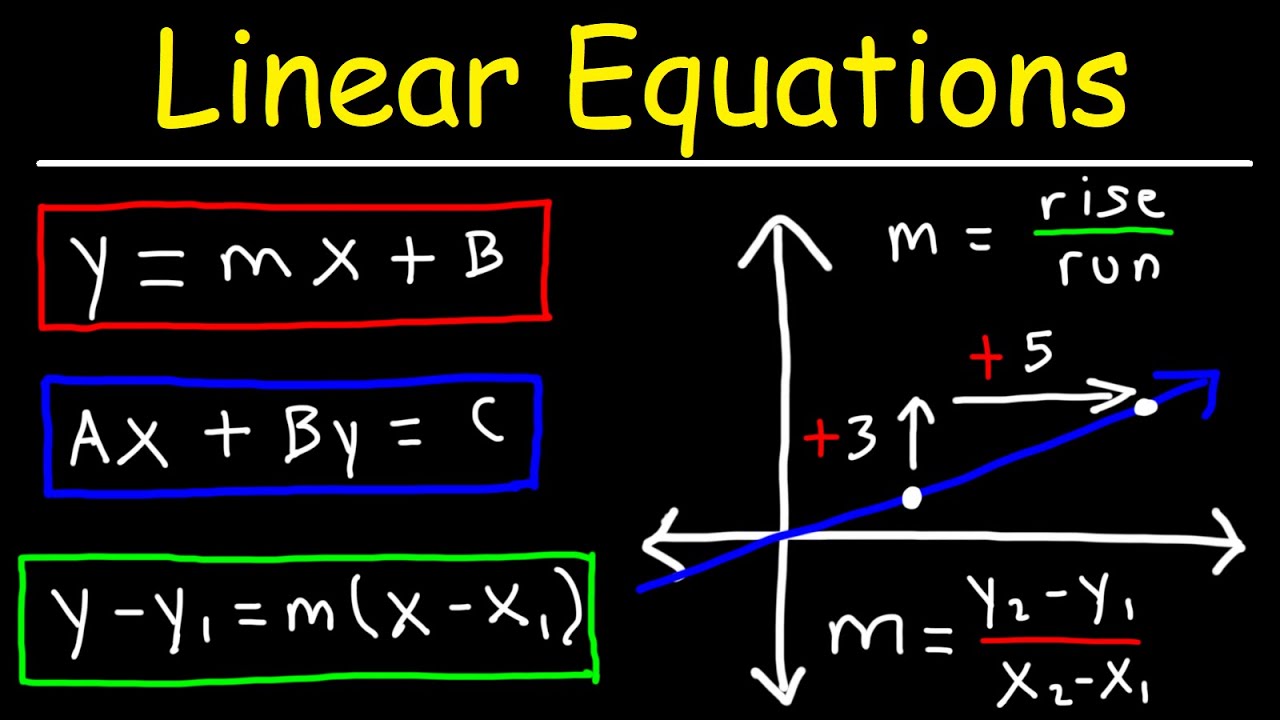
- 📚 The lesson focuses on graphing a linear function, specifically in slope-intercept form (y = mx + b).
- 🔄 It's important to understand that 'f(x)' and 'y =' represent the same concept, the output of a function.
- ✍️ The function is rewritten in terms of 'y =' to simplify the process of graphing.
- 📉 The script explains that a negative slope (-3/4) indicates a line that descends from left to right.
- 📍 The y-intercept (b) is the point where the graph crosses the y-axis, in this case, at positive 2.
- 📈 The first step in graphing is to plot the y-intercept on the y-axis.
- 🔢 The slope is interpreted as 'rise over run', which helps in plotting additional points on the graph.
- 📊 Plotting points involves moving down 3 units and to the right 4 units from the y-intercept to create a 'staircase' effect.
- 🔄 To graph on the left side of the y-intercept, the process is reversed: moving left 4 units and up 3 units to plot a point.
- 📝 The script emphasizes that all plotted points should align to form a consistent line, confirming the correct application of the slope.
- 🎓 The lesson concludes by reiterating that the graphed function y = -3/4x + 2 is equivalent to f(x) = -3/4x + 2, and encourages subscribing to the channel for more lessons.
Q & A
What is the main topic of this lesson?
-The main topic of this lesson is graphing a linear function.
Why does the instructor suggest rewriting the function in terms of 'y equals'?
-The instructor suggests rewriting the function in terms of 'y equals' to make it easier to work with when graphing.
What form of the equation is the instructor referring to when they mention 'MX plus B form'?
-The 'MX plus B form' refers to the slope-intercept form of a linear equation, where M represents the slope and B represents the y-intercept.
What does a negative slope indicate about the graph of a linear function?
-A negative slope indicates that the line will be descending from left to right on the graph.
How does the instructor determine the y-intercept from the given equation?
-The instructor determines the y-intercept by identifying the B value in the slope-intercept form of the equation, which is positive 2 in this case.
What is the first step in graphing a linear function according to the instructor?
-The first step is to plot the y-intercept on the y-axis.
What does the instructor mean by 'rise over run' in the context of graphing a line?
-'Rise over run' refers to the concept of slope, where 'rise' is the change in y (vertical change) and 'run' is the change in x (horizontal change).
How does the instructor apply the slope to find additional points on the graph?
-The instructor applies the slope by moving down 3 units on the y-axis (the rise) and then moving to the right 4 units on the x-axis (the run), plotting a new point with each repetition.
What does the instructor suggest doing if you want to plot points on the left side of the y-intercept?
-The instructor suggests reversing the process by moving to the left 4 units and then up 3 units to plot points on the left side of the y-intercept.
How does the instructor confirm that the points align correctly on the graph?
-The instructor confirms alignment by seeing that all plotted points form a consistent 'staircase' pattern, indicating that they can construct a line that passes through all points.
What is the final step in graphing the linear function according to the lesson?
-The final step is to construct the line that passes through all the plotted points, completing the graph of the linear function.
Why does the instructor emphasize that 'y equals' and 'f of x equals' mean the same thing?
-The instructor emphasizes this to clarify that both expressions represent the output of the function and can be used interchangeably when graphing.
How can viewers stay updated with new lessons from the instructor?
-Viewers can subscribe to the instructor's YouTube channel, where new lessons are added every week.
What does the instructor promise regarding viewer comments on the YouTube channel?
-The instructor promises to respond to every single comment, including the mean ones, but encourages keeping the discussion nice.
Outlines

Dieser Bereich ist nur für Premium-Benutzer verfügbar. Bitte führen Sie ein Upgrade durch, um auf diesen Abschnitt zuzugreifen.
Upgrade durchführenMindmap

Dieser Bereich ist nur für Premium-Benutzer verfügbar. Bitte führen Sie ein Upgrade durch, um auf diesen Abschnitt zuzugreifen.
Upgrade durchführenKeywords

Dieser Bereich ist nur für Premium-Benutzer verfügbar. Bitte führen Sie ein Upgrade durch, um auf diesen Abschnitt zuzugreifen.
Upgrade durchführenHighlights

Dieser Bereich ist nur für Premium-Benutzer verfügbar. Bitte führen Sie ein Upgrade durch, um auf diesen Abschnitt zuzugreifen.
Upgrade durchführenTranscripts

Dieser Bereich ist nur für Premium-Benutzer verfügbar. Bitte führen Sie ein Upgrade durch, um auf diesen Abschnitt zuzugreifen.
Upgrade durchführenWeitere ähnliche Videos ansehen
Graph & illustrates Linear Function Find the Domain Range Table of values Intercepts & Slope Math 8
Linear Equations - The Intercept Form - Algebra
Linear Functions
Graph from slope-intercept equation example | Algebra I | Khan Academy
Linear Equations - Algebra
ILLUSTRATING A LINEAR FUNCTION || GRADE 8 MATHEMATICS Q2
5.0 / 5 (0 votes)
