ILLUSTRATING A LINEAR FUNCTION || GRADE 8 MATHEMATICS Q2
Summary
TLDRThis video explains the concept of linear functions, covering their definition, characteristics, and how to identify them through equations, tables, and graphs. It details the slope-intercept form (y = mx + b), where 'm' represents the slope and 'b' the y-intercept. The video demonstrates how to determine if a function is linear by examining its equation or the table of values. It also highlights the difference between linear and non-linear relationships with practical examples, such as comparing the perimeter and area of a square. Overall, it provides an accessible introduction to linear functions in algebra.
Takeaways
- 😀 A linear function is a mathematical function that can be written in the form f(x) = mx + b, where m is the slope and b is the y-intercept.
- 😀 The graph of a linear function is always a straight line, and the function itself represents a constant rate of change between the independent and dependent variables.
- 😀 In the slope-intercept form f(x) = mx + b, m represents the slope, which tells how steep the line is, and b represents the y-intercept, which is the point where the graph crosses the y-axis.
- 😀 The equation y = mx + b is equivalent to f(x) = mx + b, meaning y can be used in place of f(x).
- 😀 Linear functions are not only expressed using f(x); other notations like g(x) and h(x) can also be used to represent them.
- 😀 To identify a linear function, the equation should be in the form y = mx + b, and both x and y should have a degree of 1. If there is an exponent greater than 1, the function is not linear.
- 😀 Non-linear equations include those where variables are in the denominator or the highest degree of a variable is greater than 1, such as x^2 or 1/x.
- 😀 A table of values is linear if the dependent variable (y) increases or decreases by a constant amount as the independent variable (x) changes by a consistent amount.
- 😀 For example, if the perimeter of a square increases by 4 units for each 1-unit increase in the side length, it represents a linear function.
- 😀 In contrast, the area of a square does not form a linear function because the change in the area is not constant as the side length increases.
- 😀 The equation of a linear function can be graphed as a straight line, and the graph will reflect the slope and y-intercept of the equation.
Q & A
What is a linear function?
-A linear function is a function that can be written in the form f(x) = mx + b, where m is the slope of the line, and b is the y-intercept. The graph of a linear function is always a straight line.
What does the 'm' in the linear function equation represent?
-In the equation f(x) = mx + b, the 'm' represents the slope of the line, which indicates how steep the line is. It shows the rate of change in y with respect to x.
What does the 'b' in the linear function equation represent?
-In the equation f(x) = mx + b, the 'b' represents the y-intercept, which is the point where the graph of the function crosses the y-axis.
Is y = 3x + 4 a linear function?
-Yes, y = 3x + 4 is a linear function because it is in the form y = mx + b, with m = 3 and b = 4.
Why is y = x^2 not a linear function?
-y = x^2 is not a linear function because it does not form a straight line. It is a quadratic function where the highest degree of x is 2.
How can you tell if a function represented by a table is linear?
-To determine if a function is linear from a table, check if the change in the y-values is constant when the x-values increase by the same amount. If the change is not constant, the function is not linear.
What is the relationship between the side of a square and its perimeter in terms of linearity?
-The relationship between the side of a square and its perimeter is linear. As the side length increases by one unit, the perimeter increases by a constant value of 4.
Why is the relationship between the side of a square and its area not linear?
-The relationship between the side of a square and its area is not linear because the area increases by non-constant amounts as the side length increases. The area follows a quadratic pattern.
What is the difference between linear and non-linear functions when graphed?
-The graph of a linear function is always a straight line, while the graph of a non-linear function is not a straight line. Non-linear functions may curve or change direction.
In the equation y = 4x, what is the value of the slope?
-In the equation y = 4x, the slope is 4. This means that for every 1 unit increase in x, y increases by 4 units.
Outlines

This section is available to paid users only. Please upgrade to access this part.
Upgrade NowMindmap

This section is available to paid users only. Please upgrade to access this part.
Upgrade NowKeywords

This section is available to paid users only. Please upgrade to access this part.
Upgrade NowHighlights

This section is available to paid users only. Please upgrade to access this part.
Upgrade NowTranscripts

This section is available to paid users only. Please upgrade to access this part.
Upgrade NowBrowse More Related Video
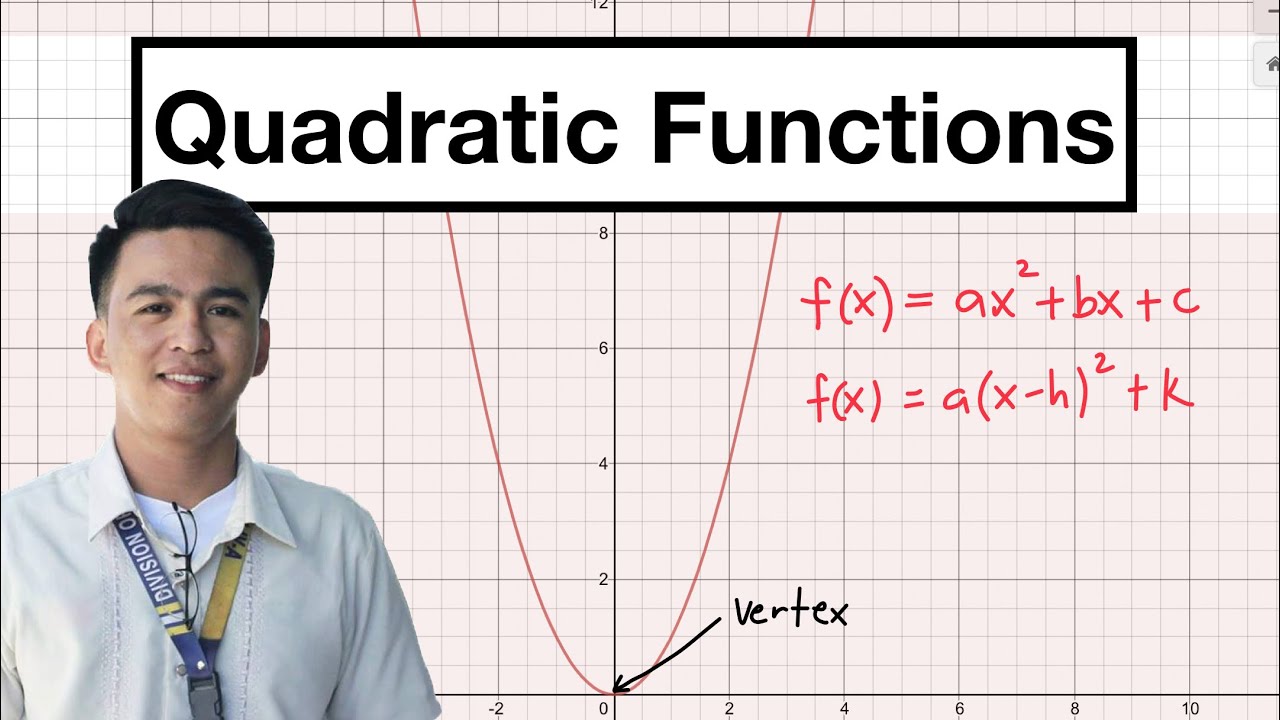
Introduction to Quadratic Function | Examples of Quadratic Function

Comparing Linear, Exponential, and Quadratic Functions

Persamaan Garis Lurus (1) | Menggambar Grafik PGL | Matematika Kelas 8

Persamaan Garis Lurus [Part 1] - Mengenal Persamaan Garis Lurus

Finding Slope
memahami konsep persamaan linear satu variabel
5.0 / 5 (0 votes)