uji beda rata-rata
Summary
TLDRThis lecture covers the process of conducting an independent t-test to compare the means of two unpaired groups. The example involves assessing the impact of the Quantum Learning method versus traditional teaching on students' writing skills. The instructor explains how to calculate the t-statistic and compare it with the critical value to determine statistical significance. Key concepts such as variance, standard deviation, and the importance of sample sizes are discussed. The lecture concludes by encouraging students to apply these concepts in their research and thesis work, with the option to ask further questions via WhatsApp.
Takeaways
- 😀 The lecture covers the two-sample t-test for comparing the means of two independent groups.
- 😀 The two groups in the example are an experimental group and a control group, tested with different teaching methods (Quantum Learning vs. conventional methods).
- 😀 The t-test formula is introduced as: t = (X1 - X2) / sqrt(SG), where SG represents the pooled standard deviation.
- 😀 The lecture explains how to calculate the pooled standard deviation (SG) using the formula for variance and standard deviation.
- 😀 A practical example is provided, comparing the writing abilities of two classes, with different group sizes (one group has 20 participants and the other has 18).
- 😀 The significance of the t-test is determined by comparing the calculated t-value (t-hitung) with the critical value from the t-table (t-tabel).
- 😀 The difference between pre-test and post-test scores is crucial when performing the t-test to evaluate the impact of teaching methods.
- 😀 The variance for both groups is calculated, and the result is used to compute the pooled standard deviation.
- 😀 Even when the sample sizes are unequal, the t-test can still be used to analyze the difference between groups, as shown in the example.
- 😀 The conclusion is drawn by checking whether the calculated t-value exceeds the critical t-table value, indicating a significant effect of the teaching method.
- 😀 Students are encouraged to apply this method to their own research and statistical analysis for future scientific work, including theses or dissertations.
Q & A
What is the main topic of the lecture discussed in the transcript?
-The main topic is the comparison of the means of two independent groups using an independent samples t-test. Specifically, it focuses on analyzing the impact of a new teaching method, Quantum Learning, on students' writing ability compared to a traditional teaching method.
What statistical test is used to compare the two groups in the study?
-The t-test for independent samples (independent t-test) is used to compare the means of two independent groups. This test helps to determine if there is a significant difference between the groups' means.
How are the experimental and control groups structured in this study?
-In this study, the experimental group is taught using the Quantum Learning method, while the control group is taught using conventional methods. The experimental group consists of one class, and the control group consists of another class. These two groups are compared to see if the new method has a significant effect.
Why is it acceptable for the sample sizes of the two groups to be different?
-It is acceptable for the sample sizes to be different in independent samples t-tests, as long as the data meets the assumption of independence. The unequal sample sizes do not invalidate the analysis in this case, as the groups are not paired.
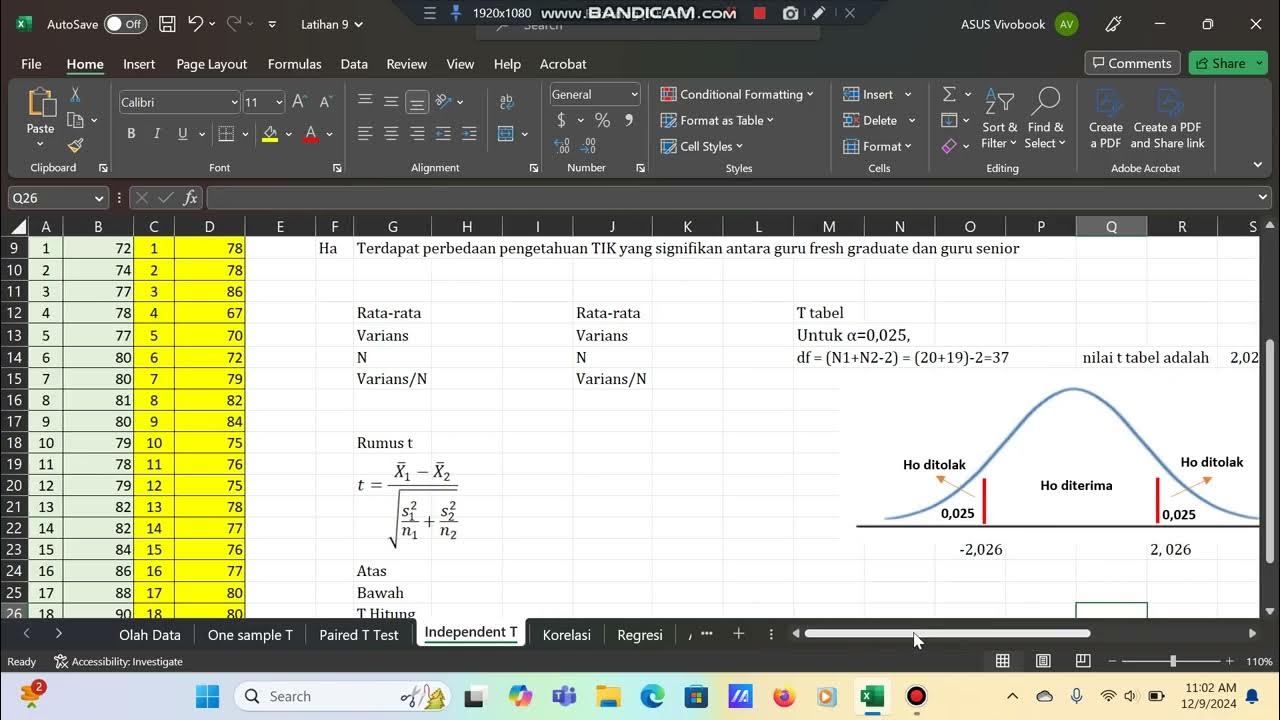
What formula is used to calculate the t-value in this context?
-The formula for the t-value in an independent t-test is: t = (X1 - X2) / (SG * sqrt((1/n1) + (1/n2))), where X1 and X2 are the sample means, SG is the pooled standard deviation, and n1 and n2 are the sample sizes of the two groups.
What is the significance of the t-hitung and t-tabel comparison?
-The t-hitung (calculated t-value) is compared with the t-tabel (critical t-value from the table). If t-hitung is greater than t-tabel, it indicates that the difference between the groups is statistically significant, suggesting the teaching method had an impact.
What result leads to the conclusion that the experimental method has a significant effect?
-If the calculated t-hitung is greater than the critical t-tabel, it indicates that the difference between the experimental and control groups is statistically significant. In the transcript's example, t-hitung was 5.05, which was greater than the critical value of 2.02, concluding that the experimental method had a significant effect.
What was the impact of the Quantum Learning method on the students' writing ability?
-The students in the experimental group (using Quantum Learning) showed a significant improvement in their writing ability, with scores ranging from 55 to 95. This compared to the control group, which showed a range of 33 to 75.
Why is it important to calculate the pooled standard deviation (SG) in this analysis?
-The pooled standard deviation (SG) is important because it is used to calculate the standard error of the difference between the means of the two groups. It allows for a more accurate comparison by combining the variance from both groups into a single value.
How can Excel help in this analysis compared to using a basic calculator?
-Excel can provide more accurate calculations, especially when dealing with complex statistical formulas like the t-test. It also helps in reducing rounding errors and automating the process, which is especially useful when performing multiple calculations or working with large datasets.
Outlines

Dieser Bereich ist nur für Premium-Benutzer verfügbar. Bitte führen Sie ein Upgrade durch, um auf diesen Abschnitt zuzugreifen.
Upgrade durchführenMindmap

Dieser Bereich ist nur für Premium-Benutzer verfügbar. Bitte führen Sie ein Upgrade durch, um auf diesen Abschnitt zuzugreifen.
Upgrade durchführenKeywords

Dieser Bereich ist nur für Premium-Benutzer verfügbar. Bitte führen Sie ein Upgrade durch, um auf diesen Abschnitt zuzugreifen.
Upgrade durchführenHighlights

Dieser Bereich ist nur für Premium-Benutzer verfügbar. Bitte führen Sie ein Upgrade durch, um auf diesen Abschnitt zuzugreifen.
Upgrade durchführenTranscripts

Dieser Bereich ist nur für Premium-Benutzer verfügbar. Bitte führen Sie ein Upgrade durch, um auf diesen Abschnitt zuzugreifen.
Upgrade durchführenWeitere ähnliche Videos ansehen
KONSEP DASAR UJI BEDA MEAN | BERPASANGAN VS TIDAK BERPASANGAN ❓❓❓❓

KULIAH STATISTIK - ANALISIS T-TEST
Independent samples t-test secara manual dengan bantuan Ms. Excel
Two Sample t-test for Independent Groups | Statistics Tutorial #23| MarinStatsLectures
07 Independent Samples t-Tests in SPSS – SPSS for Beginners
How to Perform and Interpret Independent Sample T-Test in SPSS
5.0 / 5 (0 votes)
