Ukuran Penyebaran Data : Kuartil, Desil dan Persentil + Contoh Soal
Summary
TLDRThis video lesson provides an in-depth exploration of data spread measures in statistics, focusing on quartiles, deciles, and percentiles. The instructor explains their definitions, formulas, and applications in detail, showing how data is divided into equal parts for analysis. Key concepts such as cumulative frequency, interval classes, and how to calculate various percentiles and quartiles from both ungrouped and grouped data are covered. Practical examples are provided to illustrate the methods, ensuring clarity in understanding the importance of these statistical tools for data interpretation and analysis.
Takeaways
- 😀 The video introduces the concept of data dispersion measures in mathematics, focusing on quartiles, deciles, and percentiles.
- 😀 Quartiles divide ordered data into four equal parts, with three quartiles: Q1 (lower quartile), Q2 (median), and Q3 (upper quartile).
- 😀 The method for calculating quartiles depends on whether the total number of data points (n) is odd or even.
- 😀 When n is divisible by 4, the formula for calculating Q1, Q2, and Q3 involves straightforward division of n+1 by 4.
- 😀 For grouped data, the formula for quartiles is more complex, involving cumulative frequency and class intervals.
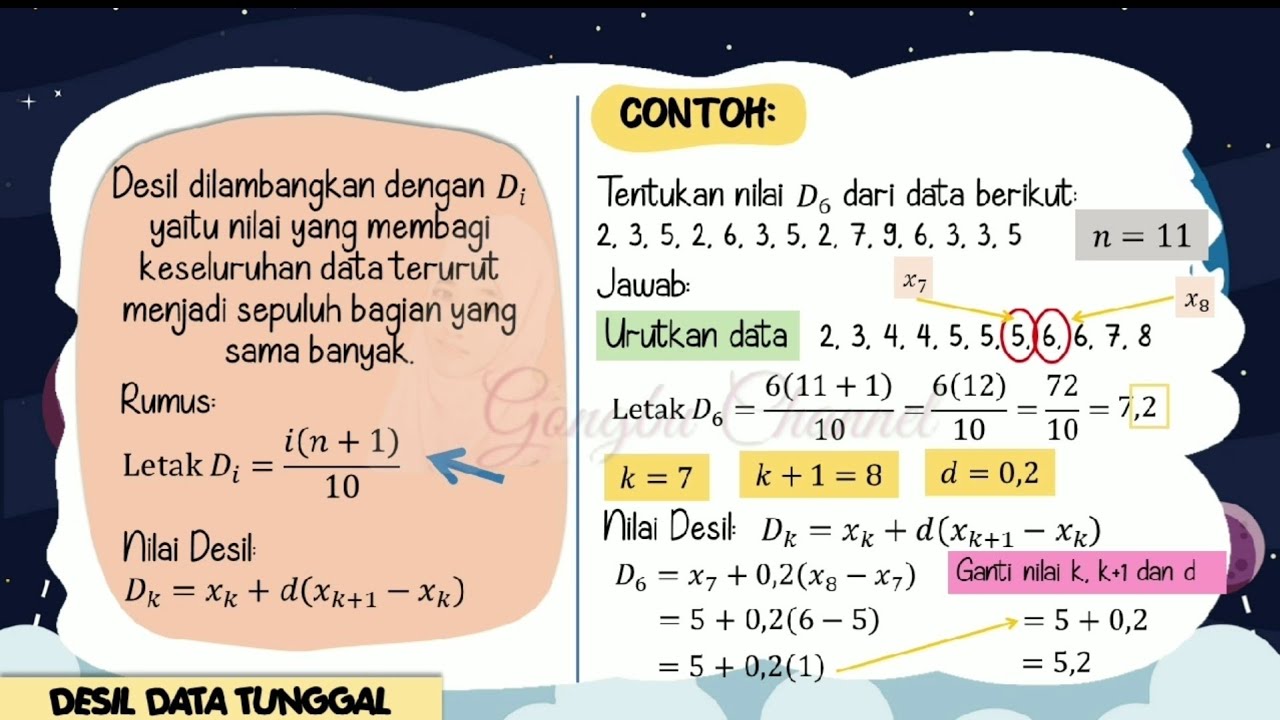
- 😀 Deciles divide data into 10 equal parts, with the formula for calculating each decile similar to that of quartiles but with a factor of 10.
- 😀 Percentiles divide data into 100 equal parts, with the formula for calculating percentiles using a similar approach to quartiles and deciles but with a factor of 100.
- 😀 The video provides detailed examples for calculating quartiles, deciles, and percentiles, demonstrating the step-by-step process for both ungrouped and grouped data.
- 😀 For grouped data, the class containing the desired quartile, decile, or percentile is first identified before applying the appropriate formulas.
- 😀 The script emphasizes the importance of sorting data in ascending order before performing any calculations for quartiles, deciles, or percentiles.
- 😀 The video concludes with practical examples, where the values for quartiles, deciles, and percentiles are calculated for specific datasets, showcasing how to apply the formulas.
Q & A
What is the purpose of data dispersion measures like quartiles, deciles, and percentiles?
-Data dispersion measures such as quartiles, deciles, and percentiles are used to understand how data points are spread out. They help identify how much individual data values deviate from the mean or central tendency, offering insights into the distribution of the data.
How are quartiles defined and how many quartiles are there?
-Quartiles divide the data into four equal parts. There are three main quartiles: Q1 (lower quartile), Q2 (median or second quartile), and Q3 (upper quartile). These quartiles are used to understand the spread of the data, with Q2 representing the median.
What is the difference between calculating quartiles for odd and even data sizes?
-For an odd number of data points, the median is the middle value, and quartiles are calculated based on the position of the data. For an even number of data points, the median is the average of the two middle values, and the quartile formulas differ slightly to accommodate this.
What is the formula for calculating quartiles in grouped data?
-For grouped data, the formula for calculating quartiles is: Q = L + [(N/4 - F) / f] * w, where L is the lower class boundary of the quartile class, N is the total frequency, F is the cumulative frequency before the quartile class, f is the frequency of the quartile class, and w is the class width.
What are deciles and how are they different from quartiles?
-Deciles divide the data into 10 equal parts, unlike quartiles which divide the data into 4 parts. There are 9 deciles, with each one corresponding to a value that separates the data into a tenth of the population.
How do you calculate the value of the 6th decile in grouped data?
-To calculate the 6th decile (D6) in grouped data, use the formula D6 = L + [(6/10 * N - F) / f] * w, where L is the lower class boundary, N is the total frequency, F is the cumulative frequency before the decile class, f is the frequency of the decile class, and w is the class width.
What is the formula for calculating percentiles in grouped data?
-The formula for calculating percentiles in grouped data is: P = L + [(P% * N - F) / f] * w, where P is the percentile being calculated (from 1 to 99), N is the total frequency, F is the cumulative frequency before the percentile class, f is the frequency of the percentile class, and w is the class width.
What is the main difference between quartiles, deciles, and percentiles?
-The main difference is how they divide the data: quartiles divide data into 4 parts, deciles divide data into 10 parts, and percentiles divide data into 100 parts. This affects how fine-grained the data analysis can be, with percentiles providing the most detailed division.
In the example provided, how is the first quartile (Q1) calculated for ungrouped data?
-For ungrouped data, first, the data is arranged in ascending order. Then, the position of Q1 is calculated using the formula Q1 = (1/4) * (n + 1), where n is the total number of data points. The value at this position in the ordered list is Q1.
How do you determine which class contains the first quartile in grouped data?
-To determine which class contains the first quartile in grouped data, calculate the cumulative frequency and identify the class where the cumulative frequency first exceeds (n/4), where n is the total number of data points. This class contains Q1.
Outlines

Dieser Bereich ist nur für Premium-Benutzer verfügbar. Bitte führen Sie ein Upgrade durch, um auf diesen Abschnitt zuzugreifen.
Upgrade durchführenMindmap

Dieser Bereich ist nur für Premium-Benutzer verfügbar. Bitte führen Sie ein Upgrade durch, um auf diesen Abschnitt zuzugreifen.
Upgrade durchführenKeywords

Dieser Bereich ist nur für Premium-Benutzer verfügbar. Bitte führen Sie ein Upgrade durch, um auf diesen Abschnitt zuzugreifen.
Upgrade durchführenHighlights

Dieser Bereich ist nur für Premium-Benutzer verfügbar. Bitte führen Sie ein Upgrade durch, um auf diesen Abschnitt zuzugreifen.
Upgrade durchführenTranscripts

Dieser Bereich ist nur für Premium-Benutzer verfügbar. Bitte führen Sie ein Upgrade durch, um auf diesen Abschnitt zuzugreifen.
Upgrade durchführenWeitere ähnliche Videos ansehen

MEASURES OF POSITION FOR UNGROUPED DATA
Ukuran Letak Data Tunggal (Kuartil, Desil dan Persentil)

Statistika - Ukuran Letak Data (Kuartil, Desil, Persentil)
QUARTILES, DECILES AND PERCENTILES OF UNGROUPED DATA || GRADE 10 MATHEMATICS Q4

UKURAN PEMUSATAN DATA BERKELOMPOK | Rataan Median Modus Kuartil Desil Persentil

Kuliah Statistika Terapan - Pemusatan Data Sesi 1 Ep.04
5.0 / 5 (0 votes)
