Pengolahan Data Geolistrik menggunakan RES2DINV
Summary
TLDRThis tutorial walks viewers through the process of geoelectric data processing using ResisV software. The data, collected from three lines of geoelectrical measurements in Talangka, Central Kalimantan, is formatted and input into ResisV for inversion. The video highlights the steps of converting raw data into the software’s required format, performing inversion with smoothing techniques to minimize RMS errors, and generating resistivity profiles. Despite initial high RMS errors, manual adjustments and iterations lead to improved results, offering a comprehensive guide to processing geoelectric data efficiently.
Takeaways
- 😀 The tutorial discusses the process of electrical resistivity data processing using Res2dinV software.
- 😀 The data is acquired from a geoelectrical survey conducted in the Talangka area, Central Kalimantan, using three 87-meter-long lines.
- 😀 The initial raw data needs to be formatted to fit the Res2dinV software specifications, which includes specific headers and electrode configurations.
- 😀 The format required by Res2dinV involves a header with survey title, electrode spacing, configuration code, number of data points, and measurement data.
- 😀 The tutorial uses a Wenner-Schlumberger configuration, which involves four columns in the data: electrode center, electrode spacing, variation number, and resistivity values.
- 😀 After data formatting, the data is imported into Res2dinV using the 'read data file' function, followed by the selection of the logaritmic transformation of apparent resistivity.
- 😀 The process includes using L2 inversion to adjust the model and minimize RMS error, indicating the difference between the observed and predicted resistivity data.
- 😀 If the inversion process doesn't produce optimal results, manual smoothing is performed to reduce anomalies in the data.
- 😀 Data smoothing is done by eliminating data points that are considered anomalies based on visual inspection and RMS error reduction.
- 😀 The tutorial demonstrates the process for three data lines, with each line's RMS error reported as 38.4%, 27.2%, and 22.2%, indicating improvement after manual adjustments.
- 😀 The final resistivity profiles are presented with horizontal distance on the top axis and depth on the left, with color-coded resistivity values to represent the subsurface layers.
Q & A
What is the primary focus of this tutorial?
-The tutorial focuses on the process of geoelectrical data processing using the software 'Resistivity V' to analyze electrical resistivity data from a survey conducted in Talangka, Central Kalimantan.
What kind of data was processed in the tutorial?
-The data processed in the tutorial was geoelectrical data obtained from a survey in Talangka, Central Kalimantan, using three survey lines, each 87 meters long.
Why was the format of the data changed before processing in 'Resistivity V'?
-The format of the data was changed to match the format required by 'Resistivity V' for proper input. The correct format included specific headers and data columns for accurate processing.
What are the key components of the data format used by 'Resistivity V'?
-The key components of the format include the survey title, electrode spacing, configuration code, number of data points, and the actual measurement data (which includes four columns: midpoint, electrode spacing, variation, and resistivity).
What configuration was used for the geoelectrical survey in this tutorial?
-The configuration used was 'Wenner SL' (4-electrode configuration), and it is identified by the number 7 in the configuration code.
What software process was shown for importing the data?
-The tutorial showed how to import data into 'Resistivity V' by selecting 'File' then 'Read Data File,' followed by selecting the appropriate data file for each survey line.
What is the purpose of the 'L Square Inversion' in the software?
-The 'L Square Inversion' is used to process the geoelectrical data by iterating to find the best fit for the resistivity model. It helps generate a more accurate representation of the subsurface resistivity.
What does the RMS error indicate in the results, and how was it addressed?
-The RMS (Root Mean Square) error indicates the discrepancy between the measured data and the model's predicted resistivity. In the tutorial, high RMS errors (38.4%) were manually reduced by 'smoothing' the data to eliminate anomalies.
How was the smoothing process carried out manually?
-The smoothing process involved manually editing and removing data points that were considered anomalous or outliers, which was done through the 'Edit' and 'Exterminate' functions in the software.
What were the RMS error values for the different survey lines, and what do they suggest?
-The RMS error values for the three lines were 38.4%, 27.2%, and 22.2%. These values indicate that the first survey line had the highest discrepancy between the model and the measured data, while the third line showed the most accurate results.
Outlines

Dieser Bereich ist nur für Premium-Benutzer verfügbar. Bitte führen Sie ein Upgrade durch, um auf diesen Abschnitt zuzugreifen.
Upgrade durchführenMindmap

Dieser Bereich ist nur für Premium-Benutzer verfügbar. Bitte führen Sie ein Upgrade durch, um auf diesen Abschnitt zuzugreifen.
Upgrade durchführenKeywords

Dieser Bereich ist nur für Premium-Benutzer verfügbar. Bitte führen Sie ein Upgrade durch, um auf diesen Abschnitt zuzugreifen.
Upgrade durchführenHighlights

Dieser Bereich ist nur für Premium-Benutzer verfügbar. Bitte führen Sie ein Upgrade durch, um auf diesen Abschnitt zuzugreifen.
Upgrade durchführenTranscripts

Dieser Bereich ist nur für Premium-Benutzer verfügbar. Bitte führen Sie ein Upgrade durch, um auf diesen Abschnitt zuzugreifen.
Upgrade durchführenWeitere ähnliche Videos ansehen
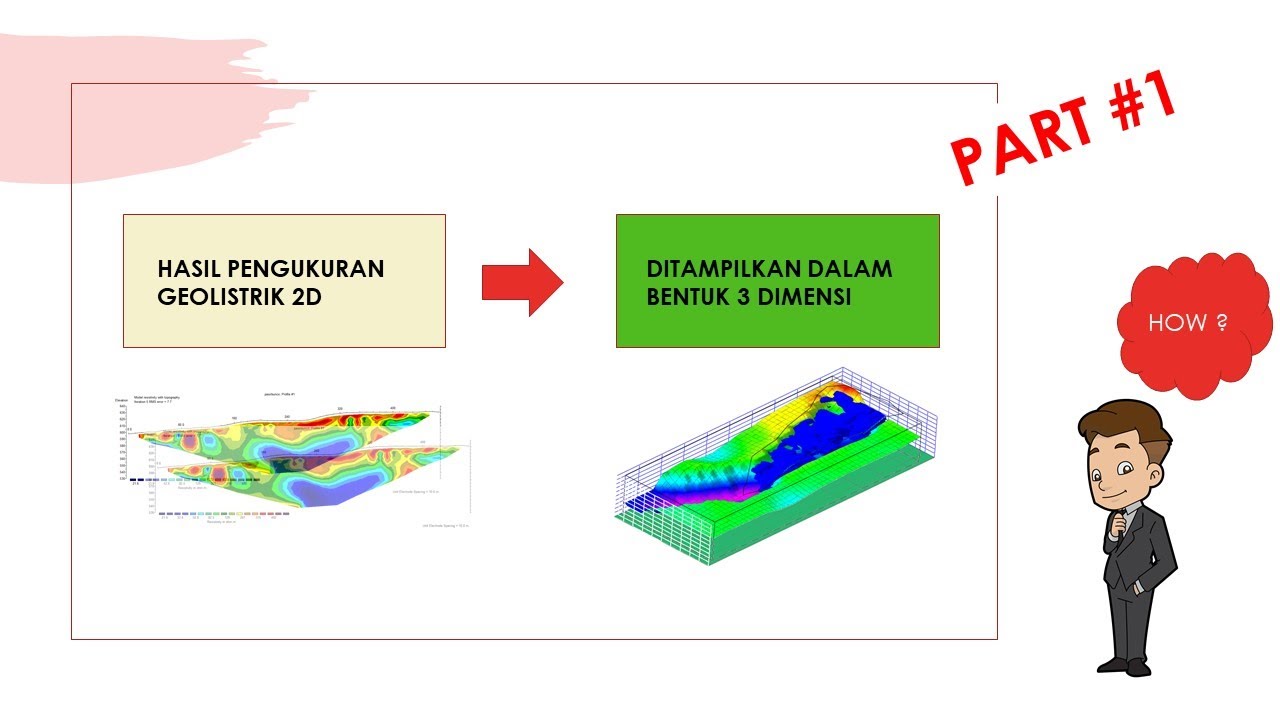
Visualisasi Geolistrik 3 D - PART #1
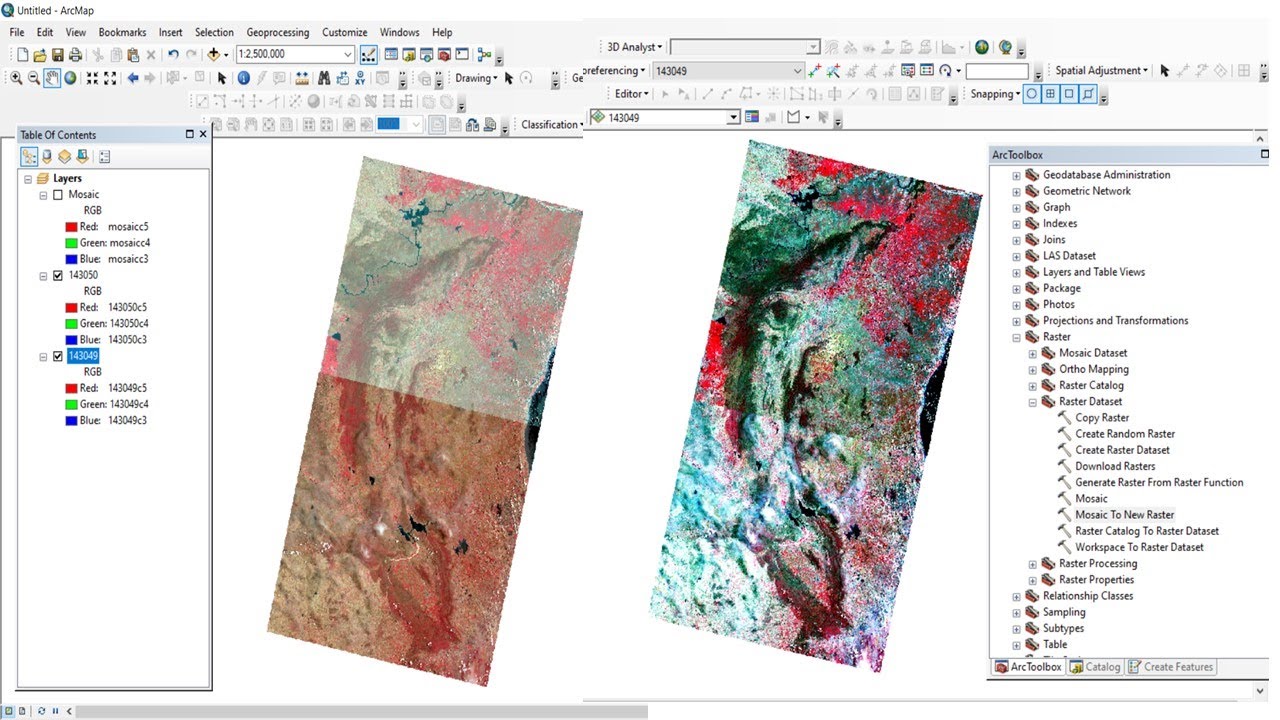
Band Composite & Mosaic of Landsat 8 data in ArcGIS

How to Create a Google Sheet from a Form | Complete Data Analysis Guide! Part 2

Seismic Refraction Training 2-1 | Data Processing - Pickwin Module

BELAJAR QGIS - Part 2: Georeferencing dan Proyeksi

COMO RECOLHER FGTS EM ATRASO DE DÉBITOS ATÉ FEV/24 | GFIP, SEFIP e CONECTIVIDADE | TUTORIAL
5.0 / 5 (0 votes)
