Measure of Central Tendency - What? Why? How? || Mean || Median || Mode || Statistics for Beginners
Summary
TLDRThis video explains the concept of measures of central tendency, including their importance and practical applications. It covers three key types: Mean, Median, and Mode. Viewers learn how these measures simplify data analysis by providing a single value to represent the central value of a dataset. The video includes clear examples, such as using the mean to compare house prices and the median for ranking students. By the end, viewers will understand how each measure is calculated and how they help in making informed decisions in various fields like marketing, HR, and education.
Takeaways
- 😀 Measure of Central Tendency is a statistical method used to find the central value of a dataset.
- 😀 It is a part of descriptive statistics, which summarizes data using one value.
- 😀 The measure of central tendency helps in making data easier to understand and simplifies comparisons between datasets.
- 😀 The three main types of measures of central tendency are Mean, Median, and Mode.
- 😀 The Mean is the average of all values in a dataset and is the most commonly used measure.
- 😀 Median is the middle value in a dataset, found by arranging the data in order and locating the center.
- 😀 If the dataset has an odd number of values, the median is the exact middle value, but for an even number, it's the average of the two middle values.
- 😀 Mode represents the value that appears most frequently in a dataset.
- 😀 If no value repeats, the dataset has no mode; if more than one value repeats with equal frequency, the dataset has multiple modes.
- 😀 Understanding central tendency helps make better decisions, such as choosing neighborhoods based on average house prices, or evaluating employee salaries and student grades.
- 😀 Each measure of central tendency is best suited to different types of data and situations, and they are used to simplify complex datasets.
Q & A
What is the measure of central tendency?
-The measure of central tendency is a way to evaluate the central value in a given dataset or series. It represents a summary of the dataset using one value, which indicates the center or middle of the data.
Why is it important to learn about the measure of central tendency?
-It simplifies data understanding by using a single value to summarize the entire dataset. It helps in comparisons between datasets and supports more informed decision-making.
How does the measure of central tendency help in real-life decision-making?
-For example, when buying a house, using the average price of houses in a neighborhood (mean) is more effective for narrowing down choices within a budget, compared to evaluating individual house prices.
What are the three common types of measures of central tendency?
-The three common types are: 1) Mean, 2) Median, and 3) Mode.
How is the mean calculated?
-The mean is calculated by adding all the values in a dataset and then dividing by the total number of values.
Can the mean be used for all types of data?
-No, the mean can only be used for numerical data. It may not accurately represent non-numerical data or data with outliers.
What is the difference between the population mean and sample mean?
-The population mean is represented by the Greek symbol 'µ' and is calculated for the entire population. The sample mean is represented by 'x̅' and is calculated from a sample of the population.
How is the median calculated?
-The median is the middle value of a dataset. If the number of values is odd, it’s the single middle value. If the number of values is even, it’s the average of the two middle values.
What happens if a dataset has an even number of values while calculating the median?
-If there’s an even number of values, the median is the average of the two middle values.
What is the mode of a dataset?
-The mode is the most frequently occurring value in a dataset. A dataset may have no mode, one mode, or multiple modes if there are multiple values with the same highest frequency.
Can the mode be used for both numerical and categorical data?
-Yes, the mode can be used for both numerical and categorical data, as it simply identifies the most frequent value.
Outlines

Dieser Bereich ist nur für Premium-Benutzer verfügbar. Bitte führen Sie ein Upgrade durch, um auf diesen Abschnitt zuzugreifen.
Upgrade durchführenMindmap

Dieser Bereich ist nur für Premium-Benutzer verfügbar. Bitte führen Sie ein Upgrade durch, um auf diesen Abschnitt zuzugreifen.
Upgrade durchführenKeywords

Dieser Bereich ist nur für Premium-Benutzer verfügbar. Bitte führen Sie ein Upgrade durch, um auf diesen Abschnitt zuzugreifen.
Upgrade durchführenHighlights

Dieser Bereich ist nur für Premium-Benutzer verfügbar. Bitte führen Sie ein Upgrade durch, um auf diesen Abschnitt zuzugreifen.
Upgrade durchführenTranscripts

Dieser Bereich ist nur für Premium-Benutzer verfügbar. Bitte führen Sie ein Upgrade durch, um auf diesen Abschnitt zuzugreifen.
Upgrade durchführenWeitere ähnliche Videos ansehen
Application of Mean, Median and Mode [In Real Life] [Uses in Real Life]

UKURAN PEMUSATAN DATA BERKELOMPOK | Rataan Median Modus Kuartil Desil Persentil

ଆସିଗଲା +2 Board Education Selection MCQ|+2 board 2026 education MCQ|Unit 4|Mcq|Unit 4|Plus two exam|
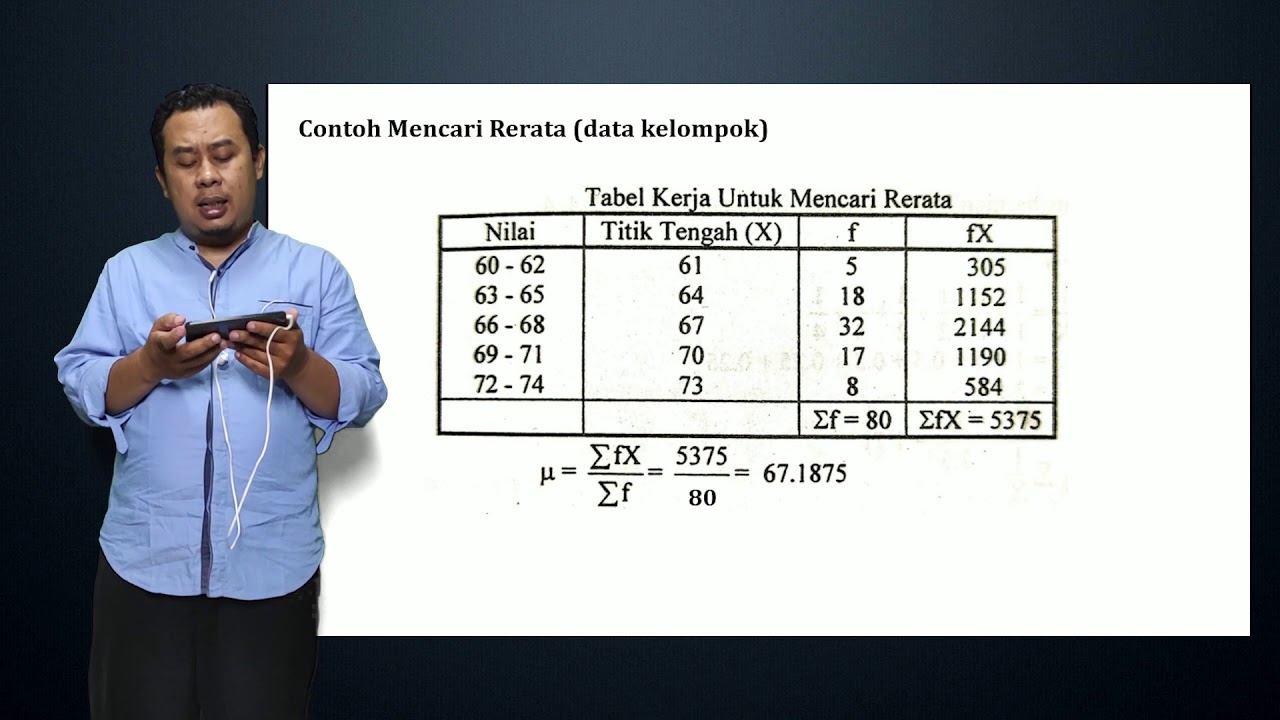
STATISTIKA PENELITIAN # 7 # (MATERI) TENDENSI SENTRAL (rerata, median, dan modus)
Tutorial 4- Measure Of Central Tendency- Mean, Median And Mode In Hindi
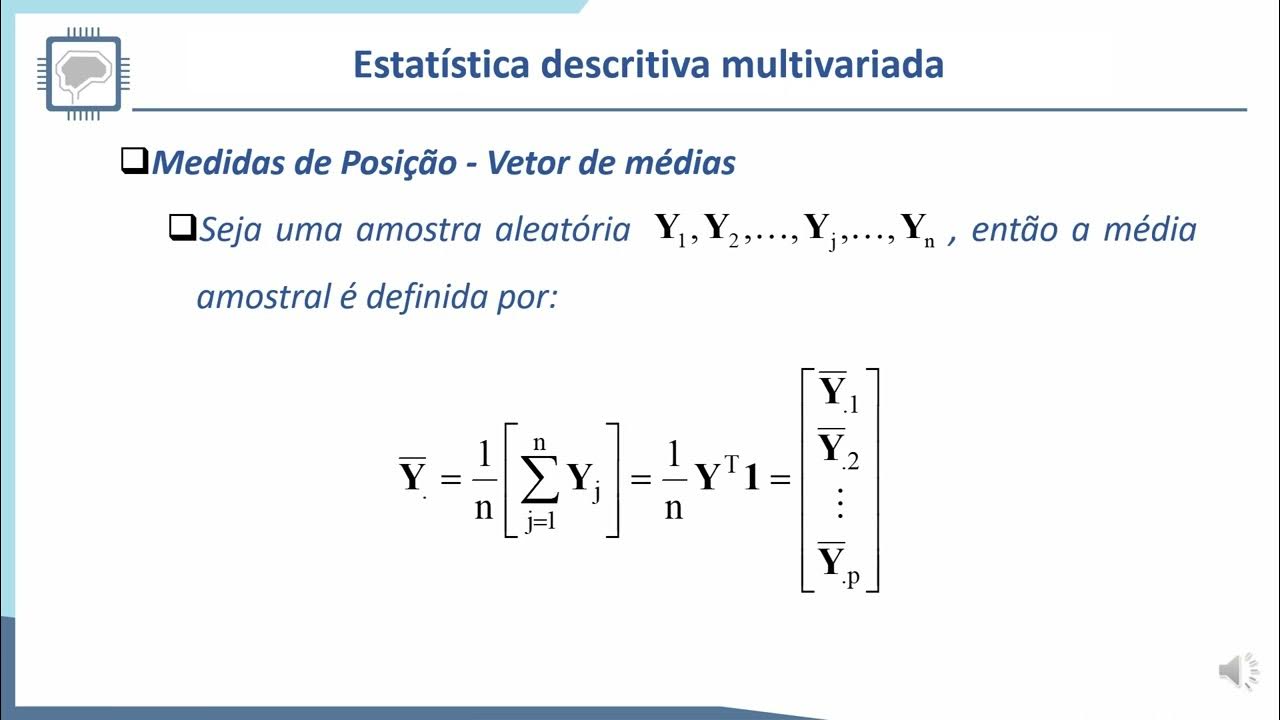
ELT573 AULA SLIDES TEORICA INTRODUÇÃO ESTATÍSTICA UNI MULTIVARIADA ACCN MN FINAL
5.0 / 5 (0 votes)
