Tutorial 4- Measure Of Central Tendency- Mean, Median And Mode In Hindi
Summary
TLDRThis YouTube video script focuses on explaining statistical concepts, specifically central tendency measures like mean, median, and mode. The presenter uses examples to clarify how these measures represent data distribution and their importance in various applications. The script also touches on the use of these statistical measures in different scenarios, emphasizing their relevance in understanding data sets and making informed decisions.
Takeaways
- 📊 The video discusses the concept of Central Tendency, focusing on Mean, Median, and Mode as key statistical measures to understand data distribution.
- 🔢 The Mean is defined as a value that represents the central tendency of a distribution and is calculated by adding all elements and dividing by the number of elements.
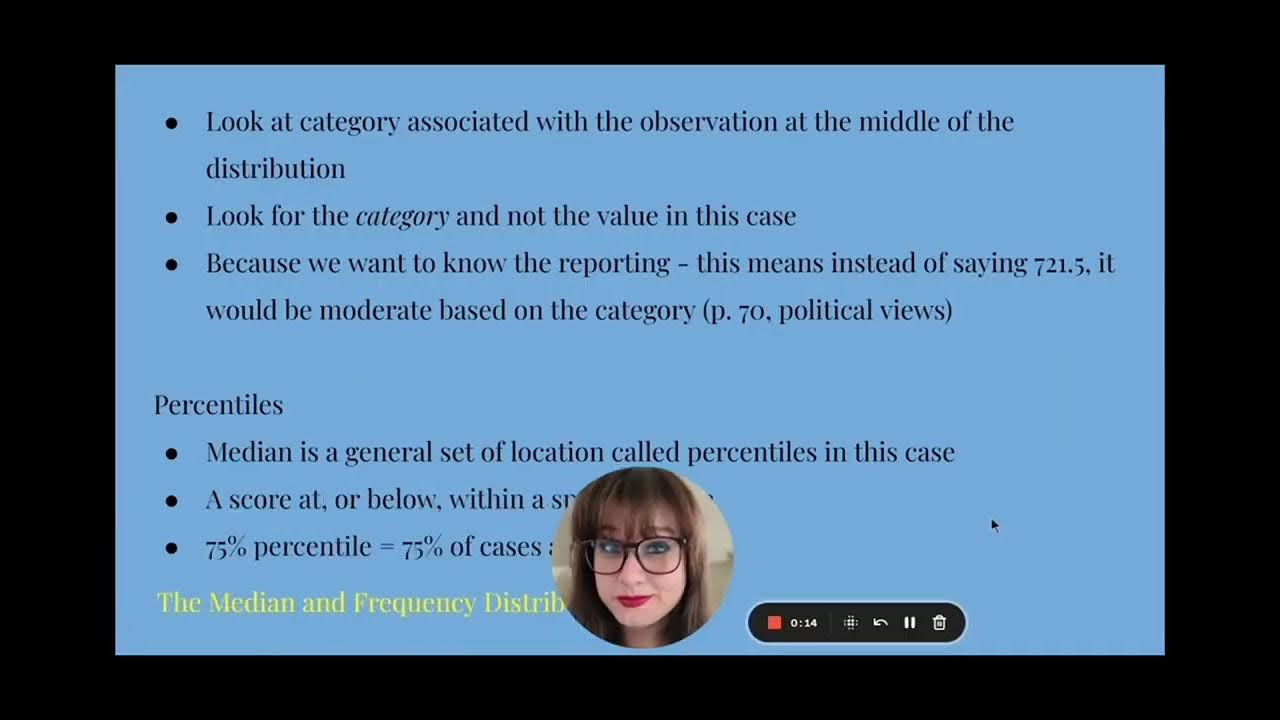
- 📈 Median is introduced as the middle value in a data set when the numbers are arranged in ascending order, offering a different perspective from the Mean.
- 📛 Mode is explained as the most frequently occurring element in a data set, which can be used to identify common trends or categories.
- 📐 The video emphasizes the importance of understanding the basic foundation of these statistical measures for various applications, including research and data analysis.
- 💡 Examples are provided to illustrate how to calculate Mean, Median, and Mode, using simple data sets to demonstrate the process.
- 📝 The script highlights the difference between population data and sample data, and how these differences affect the calculation of Mean, Median, and Mode.
- 🔎 The video touches on the practical applications of these statistical concepts, such as in project discussions and decision-making processes.
- 🌐 It mentions the use of symbols and scientific books for different types of data analysis, indicating a global approach to understanding data.
- 📋 The script also covers how to handle outliers and large data sets, suggesting techniques for managing and incorporating them into statistical calculations.
Q & A
What is the main topic discussed in the video?
-The main topic discussed in the video is the concept of central tendency, specifically focusing on measures like mean, median, and mode.
What is the definition of central tendency given in the video?
-Central tendency refers to a value that represents the center of a distribution and the data. It is used to summarize the data in a way that is easily understandable.
Why is understanding central tendency important in statistics?
-Understanding central tendency is important because it provides a basic foundation for various statistical analyses and helps in summarizing and interpreting data sets.
What are the three measures of central tendency discussed in the video?
-The three measures of central tendency discussed in the video are mean, median, and mode.
How is the mean calculated in the context of the video?
-The mean is calculated by adding all the elements of the data set and then dividing by the total number of elements.
What is the median and how is it different from the mean?
-The median is the middle value of a data set when the numbers are arranged in ascending or descending order. It is different from the mean as it is not affected by extreme values.
Can you provide an example of how the mode is determined from the video?
-The mode is determined by identifying the most frequently occurring element in the data set. For example, if the elements 1, 2, 2, 3, 4 appear, the mode would be 2 as it appears most frequently.
What is the significance of the term 'population data' in the video?
-Population data refers to the entire set of data from which a sample is drawn. The video emphasizes the importance of understanding the difference between population data and sample data when calculating central tendency.
How does the video explain the application of central tendency in real-world scenarios?
-The video explains that central tendency is applied in various real-world scenarios such as business analytics, research, and decision-making, where understanding the central value of data is crucial.
What is the role of the median in understanding data distribution according to the video?
-The median plays a significant role in understanding data distribution, especially when the data set contains outliers, as it provides a better representation of the center of the data.
How does the video differentiate between the use of mean and median in different types of data distributions?
-The video differentiates between the use of mean and median by discussing that the mean is more sensitive to outliers and should be used when the data is normally distributed, while the median is more appropriate for skewed distributions.
Outlines

This section is available to paid users only. Please upgrade to access this part.
Upgrade NowMindmap

This section is available to paid users only. Please upgrade to access this part.
Upgrade NowKeywords

This section is available to paid users only. Please upgrade to access this part.
Upgrade NowHighlights

This section is available to paid users only. Please upgrade to access this part.
Upgrade NowTranscripts

This section is available to paid users only. Please upgrade to access this part.
Upgrade NowBrowse More Related Video

Mode, Median, Mean, Range, and Standard Deviation (1.3)

Statistika #3 Ukuran Pemusatan : Mean - Modus - Median | Kelas X Fase E Kurikulum Merdeka

Ch 3 Lecture Video, Fall 2024: Measures of Central Tendency

Statistics: The average | Descriptive statistics | Probability and Statistics | Khan Academy

03. Cómo describir una variable numérica | Curso de SPSS

STATISTIKA: Ukuran gejala pusat dan ukuran letak 1
5.0 / 5 (0 votes)