KULIAH STATISTIK (5) - UKURAN PEMUSATAN DATA
Summary
TLDRIn this educational video, the instructor covers the concept of 'measures of central tendency,' which includes mean, median, and mode. The content explains how to calculate these measures for both individual and grouped data, with detailed examples. For the mean, both single and grouped data types are addressed. The median is explained in terms of its position in ordered data, while the mode is described as the most frequent value. The video also provides formulas for calculating these measures in different contexts and offers practical insights to better understand data analysis in the context of educational statistics.
Takeaways
- 😀 The video discusses 'measures of central tendency,' which include mean, median, and mode.
- 😀 The mean (or average) is calculated by summing all data points and dividing by the number of data points.
- 😀 The median is the middle value in an ordered data set, with distinct formulas for odd and even data sets.
- 😀 The mode is the most frequent data value in a set, which may have multiple modes if different values repeat equally.
- 😀 To calculate the mean for grouped data, a formula involving the frequency and midpoint of each class interval is used.
- 😀 For grouped data, the median is found by identifying the class interval containing the median position and applying a formula.
- 😀 The mode for grouped data is calculated using a formula involving the class boundaries and frequencies of the modal class and its adjacent classes.
- 😀 Median values for even-numbered data sets are found by averaging the two middle numbers after sorting the data.
- 😀 The script highlights that understanding how to calculate the mean, median, and mode is essential in statistics and educational data analysis.
- 😀 Examples provided in the video help viewers understand the practical application of these measures using sample data sets from university exams.
Q & A
What is the concept of 'measure of central tendency' as discussed in the video?
-Measure of central tendency refers to statistical measures that summarize or represent a set of data. In this context, it includes the mean, median, and mode, which describe the central or typical values in a data set.
What is the meaning of 'mean' in statistics, and how is it calculated for single data?
-The 'mean' (or average) is the sum of all data points divided by the number of data points. For example, to calculate the mean for a set of 10 data points, you sum all values and divide by 10.
How is the mean calculated for grouped data?
-For grouped data, the mean is calculated by multiplying the frequency of each class by the midpoint of the class, summing these products, and then dividing by the total number of data points.
What does the 'median' represent in statistics, and how is it calculated for single data?
-The median represents the middle value in a sorted data set. If the data set has an odd number of values, the median is the middle value; if it has an even number of values, the median is the average of the two middle values.
How is the median calculated for grouped data?
-For grouped data, the median is determined by finding the class interval where the cumulative frequency reaches or exceeds half of the total number of data points, and then applying the median formula.
What is the 'mode' in statistics, and how is it determined?
-The mode is the value that appears most frequently in a data set. For grouped data, the mode is identified by locating the class interval with the highest frequency.
What is the formula for calculating the mean for grouped data?
-The formula for the mean of grouped data is Σ(f * x) / Σf, where f is the frequency of each class and x is the midpoint of each class.
How do you calculate the median for grouped data using the formula?
-To calculate the median for grouped data, use the formula: Median = L + [(n/2 - F) / f] * w, where L is the lower boundary of the median class, n is the total frequency, F is the cumulative frequency before the median class, f is the frequency of the median class, and w is the class width.
Can there be multiple modes in a data set, and how is this determined?
-Yes, a data set can have multiple modes if two or more values appear with the same highest frequency. In such cases, all values with the highest frequency are considered modes.
What steps are involved in calculating the mode for grouped data?
-To calculate the mode for grouped data, you need to first identify the modal class (the class with the highest frequency), then use the formula: Mode = L + [(f1 - f0) / (2f1 - f0 - f2)] * w, where f1 is the frequency of the modal class, f0 is the frequency of the class before it, f2 is the frequency of the class after it, L is the lower boundary of the modal class, and w is the class width.
Outlines

Dieser Bereich ist nur für Premium-Benutzer verfügbar. Bitte führen Sie ein Upgrade durch, um auf diesen Abschnitt zuzugreifen.
Upgrade durchführenMindmap

Dieser Bereich ist nur für Premium-Benutzer verfügbar. Bitte führen Sie ein Upgrade durch, um auf diesen Abschnitt zuzugreifen.
Upgrade durchführenKeywords

Dieser Bereich ist nur für Premium-Benutzer verfügbar. Bitte führen Sie ein Upgrade durch, um auf diesen Abschnitt zuzugreifen.
Upgrade durchführenHighlights

Dieser Bereich ist nur für Premium-Benutzer verfügbar. Bitte führen Sie ein Upgrade durch, um auf diesen Abschnitt zuzugreifen.
Upgrade durchführenTranscripts

Dieser Bereich ist nur für Premium-Benutzer verfügbar. Bitte führen Sie ein Upgrade durch, um auf diesen Abschnitt zuzugreifen.
Upgrade durchführenWeitere ähnliche Videos ansehen
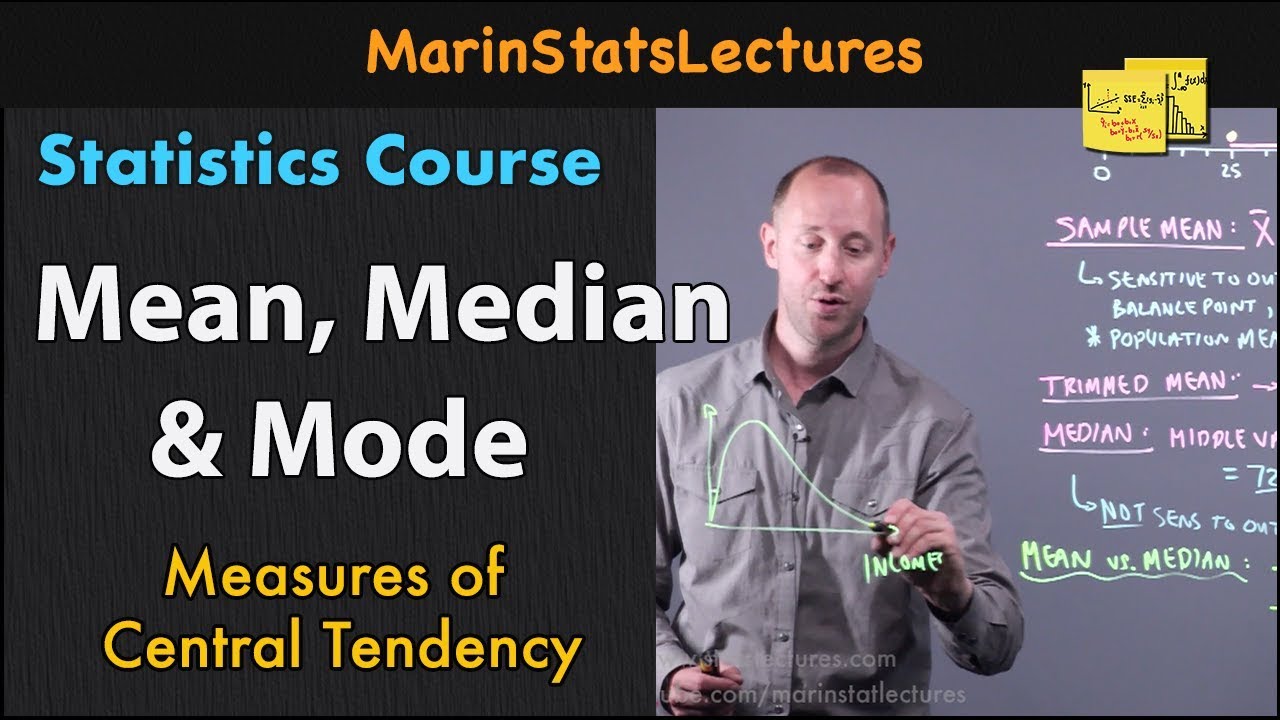
Mean, Median and Mode in Statistics | Statistics Tutorial | MarinStatsLectures

MAT 152 SAS 8 Video
Measure of Central Tendency - What? Why? How? || Mean || Median || Mode || Statistics for Beginners

STATISTIKA: Ukuran gejala pusat dan ukuran letak 1

UKURAN PEMUSATAN DATA BERKELOMPOK | Rataan Median Modus Kuartil Desil Persentil
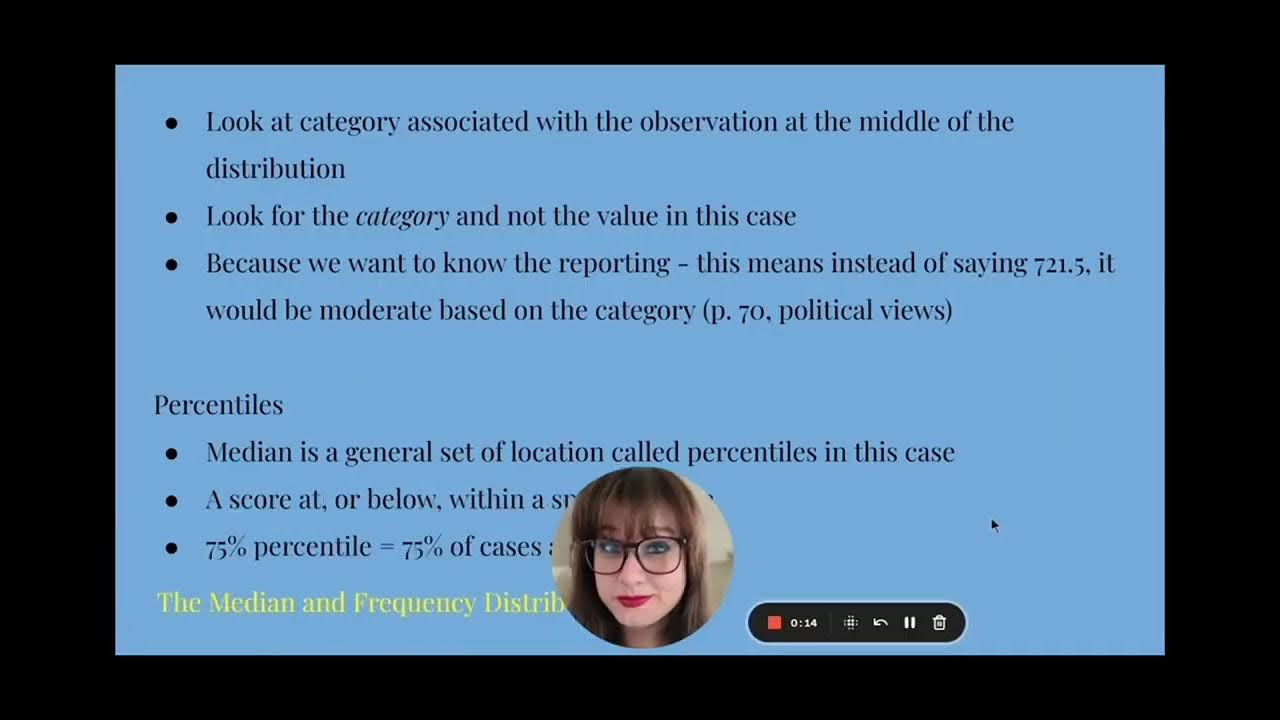
Ch 3 Lecture Video, Fall 2024: Measures of Central Tendency
5.0 / 5 (0 votes)
