STATISTIKA: Ukuran gejala pusat dan ukuran letak 1
Summary
TLDRThis video lecture covers key concepts in statistics, focusing on measures of central tendency: mean, median, and mode. The instructor explains various methods for calculating the mean, including arithmetic, harmonic, and weighted averages, with practical examples using grouped and ungrouped data. The lecture also delves into the calculation of median and mode for grouped data, providing formulas and step-by-step examples. These explanations are intended to help students better understand and apply statistical measures, ensuring a thorough grasp of fundamental statistical analysis techniques.
Takeaways
- 😀 The focus of today's lecture is on central tendency measures, specifically the mean (average), median, and mode.
- 😀 The mean (average) is a single value that represents the central data point of a dataset, calculated by adding all the values and dividing by the number of data points.
- 😀 The mean can be calculated in different ways: simple mean, weighted mean, and harmonic mean, each suited for different types of data.
- 😀 The median is the middle value in a dataset when it is ordered from smallest to largest. It is used when the data is skewed or has outliers.
- 😀 The mode represents the most frequently occurring value in a dataset.
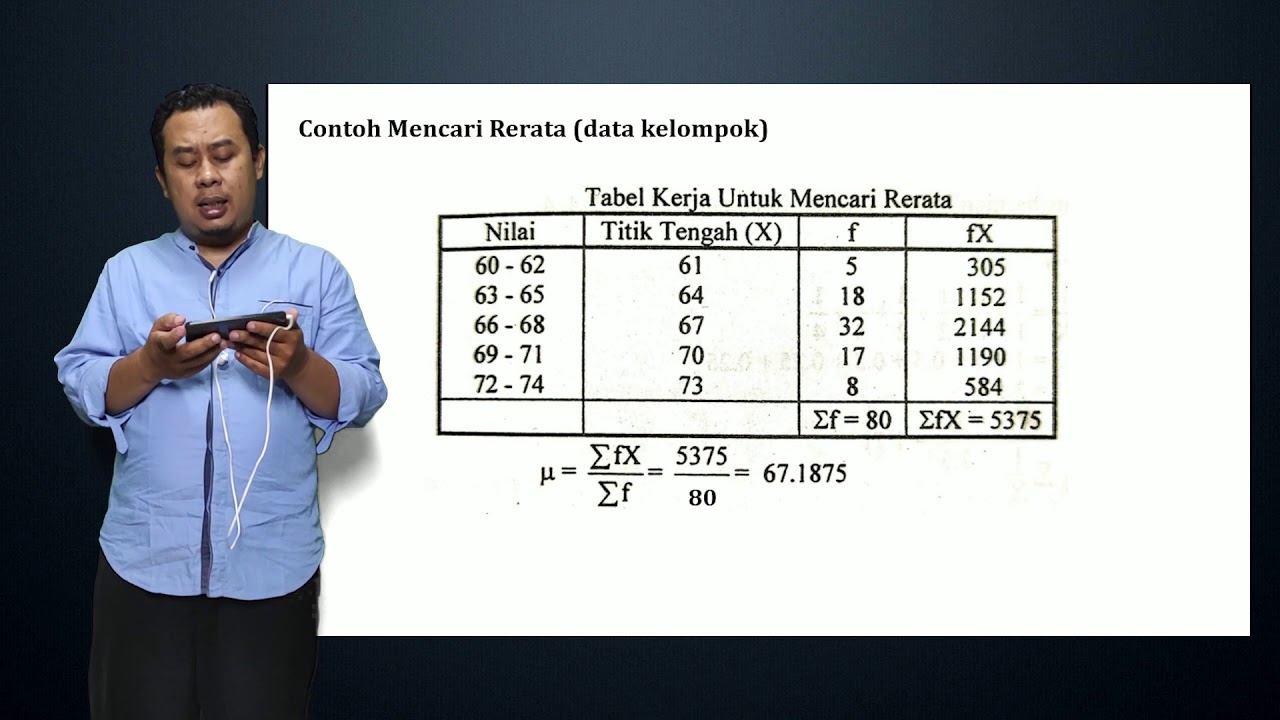
- 😀 The script provides an example of calculating the mean using grouped data, including steps like finding the midpoint of intervals and applying frequency.
- 😀 A weighted mean calculation involves assigning different weights to values, such as in cases where tasks or exams have different importance (weights).
- 😀 There are multiple methods to calculate the mean for grouped data, such as using the midpoint and multiplying by frequencies, or applying a weighted average method.
- 😀 The median for grouped data is found using a formula that involves the cumulative frequency, class boundaries, and frequency of the median class.
- 😀 The mode for grouped data is calculated using a formula that factors in the class frequencies before and after the mode class, helping to identify the most frequent range.
Q & A
What is the purpose of central tendency measures in statistics?
-Central tendency measures, such as mean, median, and mode, represent a single value that summarizes or reflects the center of a dataset. They provide an overview of the data's distribution and central position.
What is the difference between mean, median, and mode?
-The **mean** is the arithmetic average of the data. The **median** is the middle value when the data is ordered, and the **mode** is the most frequent value in the dataset.
How do you calculate the mean of ungrouped data?
-To calculate the mean of ungrouped data, sum all the values and divide by the number of data points. For example, if the data consists of 60 scores, you would sum all scores and divide by 60.
How is the mean calculated for grouped data?
-For grouped data, the mean is calculated by multiplying each class's midpoint by its frequency, summing these products, and then dividing by the total frequency.
What is the formula for calculating the median of grouped data?
-The formula for calculating the median of grouped data is: Median = L + [(N/2 - F) / f] * h, where: L is the lower class boundary of the median class, N is the total frequency, F is the cumulative frequency before the median class, f is the frequency of the median class, h is the class width.
What is the mode, and how is it calculated for grouped data?
-The mode is the value that appears most frequently in the dataset. For grouped data, it is calculated using the formula: Mode = L + [(f1 - f0) / (2f1 - f0 - f2)] * h, where: L is the lower class boundary of the modal class, f1 is the frequency of the modal class, f0 is the frequency of the class before it, f2 is the frequency of the class after it, and h is the class width.
What is the difference between the weighted mean and the regular mean?
-A **weighted mean** is calculated by assigning different weights to each data point, reflecting its importance or frequency. In contrast, a regular mean treats all data points equally.
What is the harmonic mean, and when should it be used?
-The harmonic mean is used when dealing with rates or ratios, such as in speed or efficiency calculations. It is calculated as the reciprocal of the average of the reciprocals of the data points.
What does the frequency table look like when calculating the mean for grouped data?
-The frequency table for calculating the mean includes columns for the class intervals, midpoints of those intervals, frequencies, the product of frequencies and midpoints (fx), and the sum of all fx values.
How can you determine the midpoint of a class interval?
-The midpoint of a class interval is calculated by adding the lower and upper boundaries of the interval and dividing by two.
Outlines

Dieser Bereich ist nur für Premium-Benutzer verfügbar. Bitte führen Sie ein Upgrade durch, um auf diesen Abschnitt zuzugreifen.
Upgrade durchführenMindmap

Dieser Bereich ist nur für Premium-Benutzer verfügbar. Bitte führen Sie ein Upgrade durch, um auf diesen Abschnitt zuzugreifen.
Upgrade durchführenKeywords

Dieser Bereich ist nur für Premium-Benutzer verfügbar. Bitte führen Sie ein Upgrade durch, um auf diesen Abschnitt zuzugreifen.
Upgrade durchführenHighlights

Dieser Bereich ist nur für Premium-Benutzer verfügbar. Bitte führen Sie ein Upgrade durch, um auf diesen Abschnitt zuzugreifen.
Upgrade durchführenTranscripts

Dieser Bereich ist nur für Premium-Benutzer verfügbar. Bitte führen Sie ein Upgrade durch, um auf diesen Abschnitt zuzugreifen.
Upgrade durchführenWeitere ähnliche Videos ansehen
Statistik Deskriptif

Statistika Dasar Ukuran Pemusatan Data (Mean, Modus, Median) Data Tunggal dan Data Kelompok
2.5 Medidas descriptivas

Statistics: The average | Descriptive statistics | Probability and Statistics | Khan Academy
Ukuran pemusatan data, mean median modus, Statistika
STATISTIKA PENELITIAN # 7 # (MATERI) TENDENSI SENTRAL (rerata, median, dan modus)
5.0 / 5 (0 votes)
