MEMBUAT PETA CURAH HUJAN ISOHYET DI ARCGIS
Summary
TLDRIn this tutorial, users learn how to create a rainfall map using the Isohyet method with GIS software. The process involves preparing rainfall data and administrative boundaries, converting Excel data into GIS formats, and performing spatial analysis to visualize rainfall patterns. The tutorial covers essential steps such as configuring display settings, running interpolation (IDW), and customizing the map’s appearance with color schemes and classifications. Viewers are encouraged to explore the map further and adapt it to their needs. The video concludes with a call to engage through likes, comments, and subscriptions.
Takeaways
- 😀 The video demonstrates how to create a rainfall map using ArcGIS with the isohyet method.
- 😀 You will need rainfall data and the coordinates of rain stations to create the map.
- 😀 Additionally, administrative region boundary data (shapefile) is required for the mapping process.
- 😀 The tutorial includes a link to download the necessary files, which should be imported into ArcGIS.
- 😀 The first step involves preparing the data, including rainfall data and coordinates (X, Y).
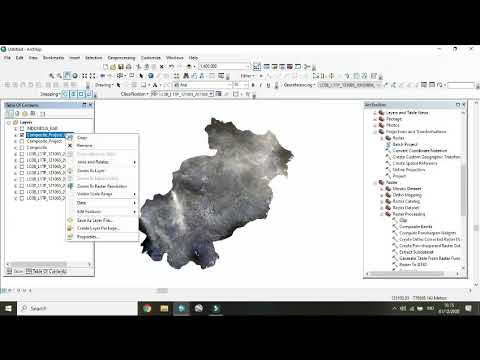
- 😀 Administrative boundary data (shapefiles) can be added by using the 'Add Data' function in ArcGIS.
- 😀 Once the boundary data is added, ensure that the region's names are visible and properly formatted.
- 😀 Rainfall data from an Excel file can be imported into ArcGIS using the 'Conversion Tools' menu.
- 😀 The data should be matched with geographic coordinates (WGS 1984 projection) for accurate mapping.
- 😀 The IDW (Inverse Distance Weighting) method is used for spatial interpolation to create the rainfall map.
- 😀 After generating the map, classification and color customization options are available to suit the user's needs.
Q & A
What is the purpose of the tutorial in the video?
-The tutorial demonstrates how to create a rainfall map using the isohyet method, which requires rainfall data and the coordinates of the rainfall stations.
What data is required to create the rainfall map?
-You need rainfall data, including coordinates of the stations (latitude and longitude), and optionally the year. Additionally, a shapefile of the administrative areas to be mapped is required.
What tool is used to convert the Excel file to a table in the GIS software?
-The 'Excel to Table' conversion tool is used to import the rainfall data from the Excel file into the GIS software.
Why is it important to use the WGS 1984 coordinate system?
-Using the WGS 1984 coordinate system ensures that the spatial data aligns correctly with global mapping standards, providing accuracy in the map projection.
What is the IDW tool, and how is it used in this tutorial?
-The IDW (Inverse Distance Weighted) tool is used for spatial interpolation, helping to estimate rainfall values across the mapped area. It takes the rainfall data and creates a continuous surface based on the distance between points.
How can the result of the IDW tool be visualized?
-The results of the IDW tool can be visualized by right-clicking on the output layer, selecting 'Properties', and adjusting the symbology to 'Classified' for categorizing the rainfall values.
What does the 'Classified' symbology option do in GIS?
-The 'Classified' symbology option categorizes the rainfall values into predefined classes (e.g., 5 categories), helping to visualize the distribution of rainfall levels more effectively.
What should be done after visualizing the results on the map?
-After visualizing the results, the map can be exported for further use or sharing, and the legend can be adjusted to match the classification of rainfall levels.
Can the rainfall map be customized further?
-Yes, the map can be customized based on specific needs, such as adjusting the color scheme, classification, or adding additional layers for more detailed analysis.
What is the final recommendation for viewers of the tutorial?
-Viewers are encouraged to like, comment, and subscribe for more tutorials and to ask any questions in the comments section if they encounter issues or need further clarification.
Outlines

Dieser Bereich ist nur für Premium-Benutzer verfügbar. Bitte führen Sie ein Upgrade durch, um auf diesen Abschnitt zuzugreifen.
Upgrade durchführenMindmap

Dieser Bereich ist nur für Premium-Benutzer verfügbar. Bitte führen Sie ein Upgrade durch, um auf diesen Abschnitt zuzugreifen.
Upgrade durchführenKeywords

Dieser Bereich ist nur für Premium-Benutzer verfügbar. Bitte führen Sie ein Upgrade durch, um auf diesen Abschnitt zuzugreifen.
Upgrade durchführenHighlights

Dieser Bereich ist nur für Premium-Benutzer verfügbar. Bitte führen Sie ein Upgrade durch, um auf diesen Abschnitt zuzugreifen.
Upgrade durchführenTranscripts

Dieser Bereich ist nur für Premium-Benutzer verfügbar. Bitte führen Sie ein Upgrade durch, um auf diesen Abschnitt zuzugreifen.
Upgrade durchführenWeitere ähnliche Videos ansehen

Groundwater/Aquifer Level Map in ArcGIS
Tutorial Membuat Peta Erosi Secara Spasial Menggunakan Arcgis dengan rumus USLE

Pembuatan Peta Administrasi Kabupaten Sidoarjo dengan QGIS | UAP MSDL Shif A

TUTORIAL DASAR MEMBUAT PETA MENGGUNAKAN ARCGIS 10.8
Cara Membuat Peta Tutupan Lahan dengan ArcGIS (by. Denisya Putri)
How to Prepare Slope Map from DEM #shorts #youtubeshorts #gis
5.0 / 5 (0 votes)
