Production Possibilities Curve
Summary
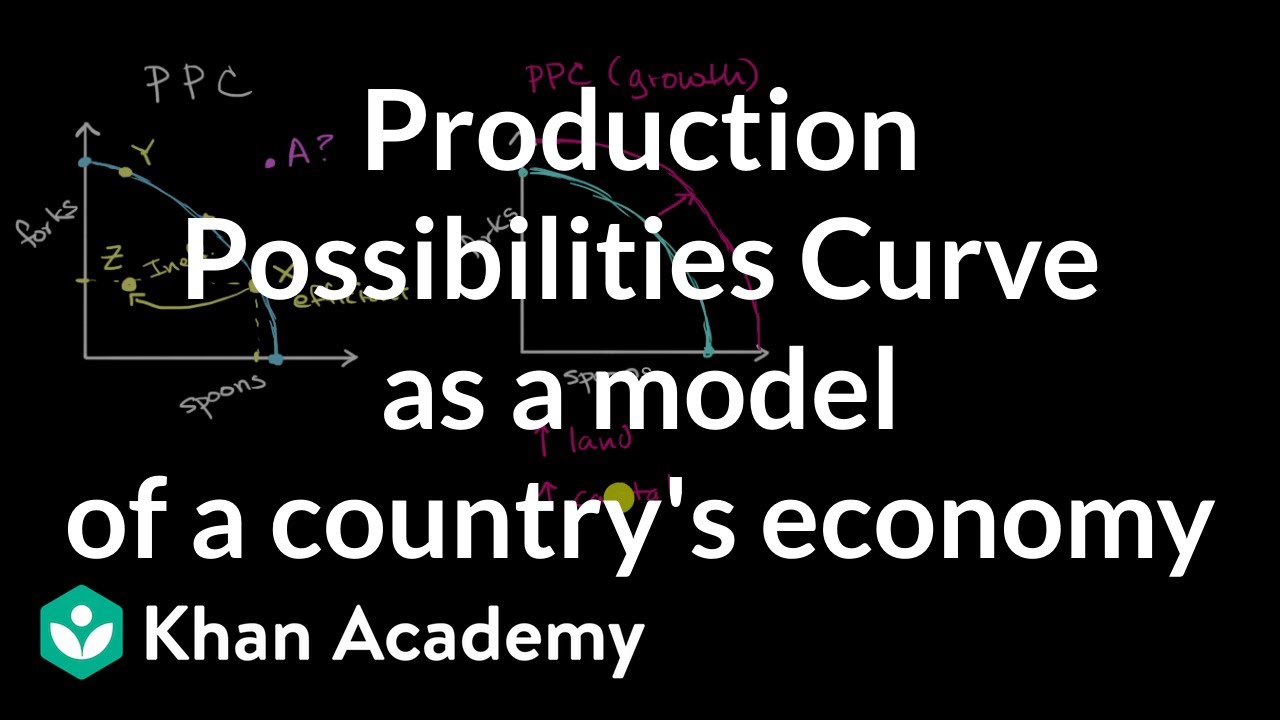
TLDRThe video explains the Production Possibilities Curve (PPC), a key concept in economics. It uses a simple example of an economy producing pizzas and robots to demonstrate trade-offs and opportunity costs due to scarcity of resources. The PPC illustrates how increasing production of one good leads to greater opportunity costs for the other. Real-world examples like national defense vs. civilian goods, and the law of increasing opportunity costs, show how resources are allocated. The video emphasizes that the more you produce of something, the higher its opportunity cost becomes.
Takeaways
- 📊 The Production Possibilities Curve (PPC) is a fundamental economics model that illustrates the concept of scarcity and trade-offs.
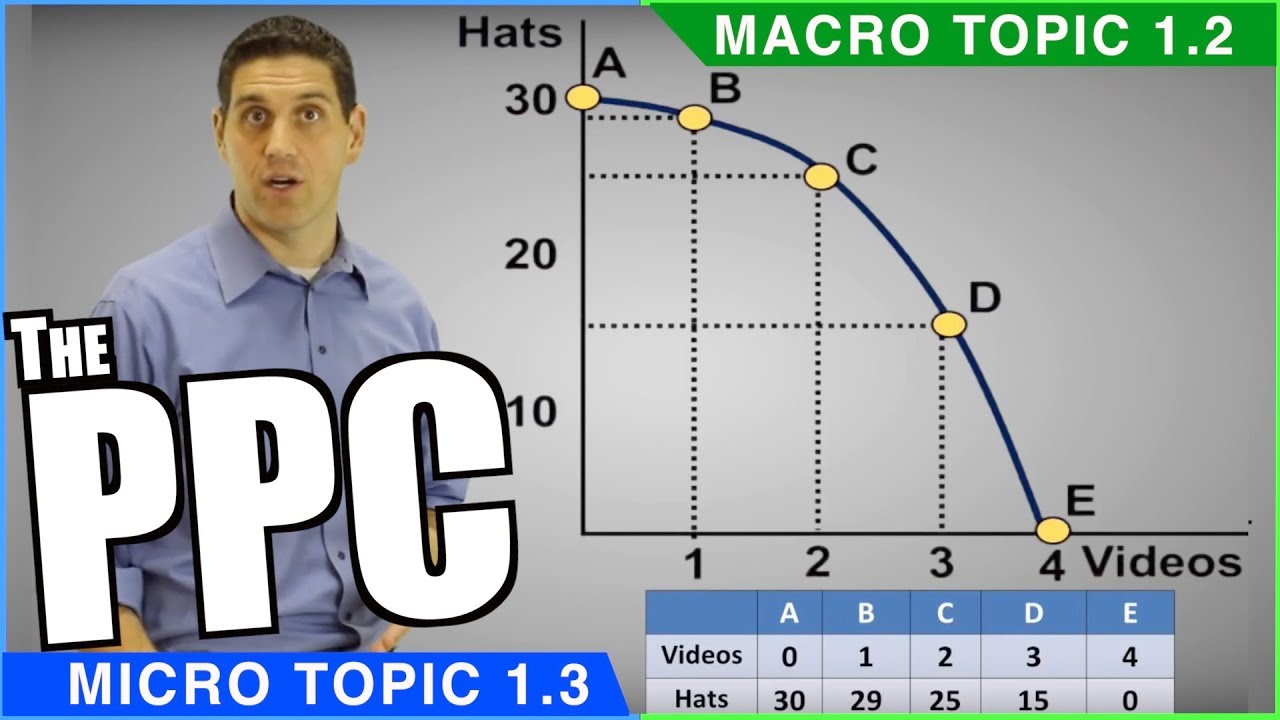
- 🍕 In a simplified economy producing only two goods, like pizzas and robots, the PPC shows how focusing on one good reduces the capacity to produce the other.
- ⚙️ When all resources are devoted to making robots, no pizzas can be produced, and vice versa. Different combinations of robots and pizzas can be represented on a graph.
- 🔄 The concept of opportunity cost is central: producing more of one good means giving up some of the other, representing the trade-offs involved in resource allocation.
- 📉 The opportunity cost increases as more of a good is produced. For example, making additional robots becomes more expensive in terms of pizzas as production increases.
- 📈 The curve is concave (bows outward) because resources are not perfectly adaptable, meaning increasing production of one good requires using less efficient resources for that purpose.
- 🔧 As more resources are shifted to produce a certain good (like robots), the cost rises because less-suited resources must be utilized, increasing opportunity costs.
- 🌳 Economists use the analogy of picking low-hanging fruit: producers start with the easiest and cheapest resources, but as they deplete, they face higher costs to produce more.
- 🔫 The classic 'guns vs. butter' scenario demonstrates trade-offs between military and civilian goods, reflecting real-world economic decisions about resource allocation.
- 🚫 Scarcity and trade-offs mean that no economy can produce everything it wants without sacrificing the production of other goods, a key lesson of the PPC.
Q & A
What is the production possibilities curve (PPC) or frontier?
-The production possibilities curve (PPC) or frontier illustrates the trade-offs between the production of two goods in an economy, demonstrating the concept of scarcity and opportunity cost.
What is the first lesson the production possibilities curve teaches?
-The first lesson of the production possibilities curve is the economic notion of scarcity: producing more of one good means producing less of another due to limited resources.
What is the opportunity cost in the context of the production possibilities curve?
-Opportunity cost refers to the value of the next best alternative forgone when making a choice. In the production possibilities curve, producing one good means sacrificing the production of another.
How does the production possibilities curve demonstrate increasing opportunity costs?
-The production possibilities curve shows that as more of one good is produced, the opportunity cost of producing each additional unit increases because resources less suited for the task must be used.
Why is the production possibilities curve concave to the origin?
-The curve is concave to the origin because resources are not equally efficient in producing all goods, leading to increasing opportunity costs as production shifts toward one good.
What is an example of a trade-off illustrated in the video script?
-An example of a trade-off is between producing robots and pizzas. If the economy focuses more on robots, fewer pizzas can be produced, and vice versa.
What is the significance of 'low-hanging fruit' in economics?
-The concept of 'low-hanging fruit' refers to the idea that producers use the easiest and least costly resources first before moving on to more expensive alternatives.
What real-world example does the video provide to illustrate the production possibilities curve?
-The video uses the U.S. decision to allocate resources between Homeland Security and National Defense, showing how resources are shifted from civilian industries to military needs.
How does the concept of guns and butter relate to the production possibilities curve?
-The 'guns and butter' model illustrates the trade-off between military spending (guns) and consumer goods (butter), showing how resources must be allocated between different priorities.
Why do opportunity costs increase as more of a good is produced?
-Opportunity costs increase because the most efficient resources are used first, and less efficient resources must be employed as production expands, leading to higher costs.
Outlines
📈 Understanding the Production Possibilities Curve (PPC)
The first paragraph introduces the concept of the Production Possibilities Curve (PPC), commonly featured in economics textbooks. It emphasizes the fundamental economic principles of scarcity and trade-offs, using a simple economy that produces only two goods: pizzas and robots. The paragraph explains how allocating resources between these two goods results in different possible combinations. These combinations can be plotted on a graph, illustrating the trade-off between making robots and pizzas. This model represents the essence of economic scarcity—choosing one good means giving up another.
🤖 Trade-offs and Opportunity Costs on the PPC
The second paragraph delves into the idea of opportunity cost, showing how making more robots results in fewer pizzas. As production shifts from pizzas to robots, the opportunity cost (the number of pizzas forgone) increases. The example shows that as robot production increases from 4,000 to 9,000, the opportunity cost rises from 25 to 100 pizzas per robot. This highlights the law of increasing opportunity costs, demonstrating that as more of one good is produced, the cost of producing additional units of that good also rises.
Mindmap
Keywords
💡Production Possibilities Curve (PPC)
💡Scarcity
💡Trade-off
💡Opportunity Cost
💡Increasing Opportunity Cost
💡Guns and Butter
💡Finite Resources
💡Low-Hanging Fruit
💡Concave to the Origin
💡Civilian Goods
Highlights
The production possibilities curve illustrates four important economic ideas, starting with the concept of scarcity and trade-offs.
Economists simplify models by focusing on two products, like pizza and robots, to better visualize trade-offs.
If all resources are used to make robots, the economy can produce 10,000 robots but no pizza. As more pizzas are made, the possible number of robots decreases.
The production possibilities curve demonstrates the trade-off between making robots and pizzas, with each combination representing a different allocation of resources.
Opportunity cost is a key lesson: making one product means sacrificing the opportunity to make another. For example, making 9,000 robots costs 100,000 pizzas.
The opportunity cost of making more robots increases as production scales up. For example, going from 7,000 to 9,000 robots requires sacrificing 100,000 pizzas.
The concept of increasing opportunity costs explains why the production possibilities curve is concave to the origin—because producing more of one good becomes increasingly expensive in terms of the other.
Economists often use the guns versus butter analogy to represent the trade-off between consumer goods and military goods, reflecting the allocation of finite resources.
When resources are allocated to defense (guns), fewer are available for civilian goods (butter), illustrating the trade-offs faced by nations.
The more specialized the resources, the higher the opportunity cost of shifting them to produce something else, as seen in moving farmers to gun production.
The principle of 'picking the low-hanging fruit' is used to explain that economies will first use resources that are easiest and cheapest to access.
In economics, opportunity costs rise with the quantity of goods produced, due to the low-hanging fruit phenomenon.
The production possibilities curve not only demonstrates scarcity but also the idea of increasing opportunity costs, which makes it a valuable teaching tool.
The example of Homeland Security in the United States shows how resources must be moved from civilian sectors, like education and construction, to support national defense.
Trade-offs between national security and civilian production are real-world applications of the production possibilities curve, showing the limits of resource allocation.
Transcripts
the production possibilities curve a big
favorite of Economics textbooks for good
reason the production possibilities
curve or Frontier as it's sometimes
called turns out to be a very simple way
to illustrate four very important
economic ideas first it's another
demonstration that economics is based on
the idea of scarcity of
tradeoffs so imagine a fictitious
economy somewhere that makes only two
goods pizzas and robots for the sake of
clarity economists like to make their
models as simple as they can and it
doesn't get much simpler than this
anyway this economy's only two goods are
about to be put up on a table which
represents the trade-off between them
devote all this simplified economy's
resources to making robots and let's say
it can make 10,000 of them but that
means no pizza making just one pile of
pizzas the table shows means making
fewer
robots and as more pizzas are made the
possible number of robots is further
reduced down to a situation of all
pizzas and no robots at
all put the different combinations on a
graph and you've got the production
possibilities Frontier in action so if
you're willing to go without Pizza
entirely that's zero down here on the
x-axis but you can make a full 10,000
robots here on the Y AIS
so production possibility a up there
possibility B involves making at least
some pizza on the table 100,000 pies but
that means we only have the resources to
make 9,000 robots as well there's also
possibility C possibility D and this
Frontier ends down at possibility e
400,000 pizzas no robots at all the
picture looks the same for any two
products
the author of the economy today Brad
Schiller if we want to look at
production possibilities at work in a
real setting just look at the issues
that the United States is facing right
now every public opinion poll shows that
Americans want more Homeland Security
and more National Defense without
question Democrats Republicans everybody
wants it but where are we going to get
it I mean think about it if you're going
to deploy say our police forces to guard
buildings and bridges and
airports what are they going to stop
doing we're making a difficult choice so
why don't we simply hire more police it
would be wonderful if we had more police
we already have 640,000 police officers
in this country and sure we could get
more but where are we going to get them
from we have to take them out of some
other industry we're having the same
problem with the war in Iraq we have to
we have to call up tens of thousands of
national gmen who would otherwise be
producing Goods in the civilian sector
teaching schools working in construction
working as accountants these are the
National Guard who are weakend warriors
suddenly we take them out of their
civilian jobs in order to strengthen our
National Defense we're making a choice
we're moving resources from the
production of butter civilian Goods to
the production of guns our national
security it was after World War II that
economic textbook writers started using
guns and butter to illustrate that there
was a tradeoff between consumer goods
like food and military
hardware the reason behind the trade-off
as Brad Schiller says is that you have
to use finite resources like land labor
and raw materials to make anything again
say pizza and
robots if everyone in the economy is
toiling away in the robot Factory there
will be no one left for the
Parlor okay that's the first lesson of
the production possibilities curve the
economic notion of scarcity anything you
make costs you the opportunity of doing
something else with the same resources
that is their opportunity cost the
second lesson of the production
possibilities curve is a little more
subtle that the more you make of
anything the greater its opportunity
cost go from making zero robots to 4,000
of them and we get quite a payoff what
does it cost us in terms of pizza the
chart makes it clear 100,000 fewer
pizzas or to put it another way minus
100,000 pieces divided by 4,000 robots
so the first 4,000 robots cost an
average of 25 piezas per mechanical man
4,000 goes into 100, 25 times since it's
minus 100,000 that means minus 25 the
minus sign simply says this is a cost a
subtraction from what we
had but look what happens when we go
from 4,000 to 7,000 robots this time we
only get 3,000 more metal heads but but
to produce them we still have to give up
the opportunity of making 100,000
pepperoni specials so again minus
100,000 pizzas divided by a mere 3,000
robots an opportunity cost of about 33
pizzas per
robot and when we go from making 7,000
to 9,000 robots the extra 2,000
automatons still costs us 100,000
forgone pizzas therefore the opportunity
cost increases again 100,000 pies
divided by 2,000 cyborgs 50 pies per
Borg finally the last segment of the
production possibilities curve is the
costliest in terms of orders from
dominoes the last thousand Androids cost
the economy the same 100,000 pizzas but
at a whopping rate of 100 pizzas per
robot and if you spend a little more
time on this graph you you can see that
the same increasing opportunity costs
work in reverse the first 100,000 pizzas
cost one tenth of a Droid per Pizza the
last 100,000 cost four times as
much thus the law of increasing
opportunity cost but what's driving it
why is the production possibilities
Frontier concave to the origin meaning
it bows out from the place the two axis
meet like a cave or cavity it's because
things tend to cost more to produce the
more you produce of them again take the
example of guns versus butter Economist
Cecilia Conrad explains at first we can
move the resources that actually tend to
be better suited for producing guns the
people who are you know perhaps really
good at putting together I'm not sure
what it takes to produce guns these days
probably putting together electronic
circuitry we move those people first
over the production of guns so we can
start producing guns at fairly low cost
but as we try to produce move move more
more and more away from food towards
guns then we're going to eventually have
to start to bring in the people who
really spent all their life out on a
farm somewhere farming and don't have
any idea about how the industrial
process works and aren't really adjusted
to working on an assembly line and so
the cost of getting the extra gun
production is going to start to get
higher and that means and that means
that we're going to have to give up more
and more butter to get the same
incremental uh addition of guns and
similarly going similarly going the
other direction another way to look at
it is that you use your cheapest
resources before any others or to use an
old economics cliche you pick the lowest
hanging fruit first Economist Jim Clark
they go for what you can get most easily
for what has the lowest opportunity cost
when I talk about grabbing low hanging
fruit no it's just right there you just
reach up and grab it and takes hardly
any effort you didn't have to give up
very much to get it if you want the
fruit at the top of the tree you got to
haul out this big ladder and climb all
the way up and then maybe you can still
reach it up at the top but it's going to
take you 10 or 15 minutes to get it and
a lot of equipment and if you don't have
a ladder yet you got to build the ladder
so you want to pick the alternative
that's got the lowest cost in terms of
other things that you have to give up so
the the low hanging fruits the stuff
that's easy to get in other words all
producers start with the easy pickings
now there are arguments about how true
this is in every case
for example aren't computer chips
cheaper the more you make but in a
competitive market economics assumes
that opportunity costs rise with
quantity because of the loow hanging
fruit phenomenon so where are we thus
far the production possibilities curve
or Frontier has Illustrated both the
idea of tradeoffs that is scarcity you
can't have it all and the idea of
increasing opportunity costs there
remain two more key points about the
Curve but we'll get to them in the next
video
Weitere ähnliche Videos ansehen
Eco 155: Principles of Macroeconomics Class 5
(3/3) The Production Possibilities Frontier – Economic Lowdown
Macro 1.2 - Production Possibilities Curve - NEW!
Y1/IB 2) Opportunity Cost and Production Possibility Curves (PPCs)
Production Possibilities Curve- Macro Topic 1.2 (Micro Topic 1.3)
Production Possibilities Frontier: Everything you need to know!
5.0 / 5 (0 votes)