Google Sheets Mean,Median,Mode,Range

Justin Feuerriegel
4 Jul 201603:56

Summary

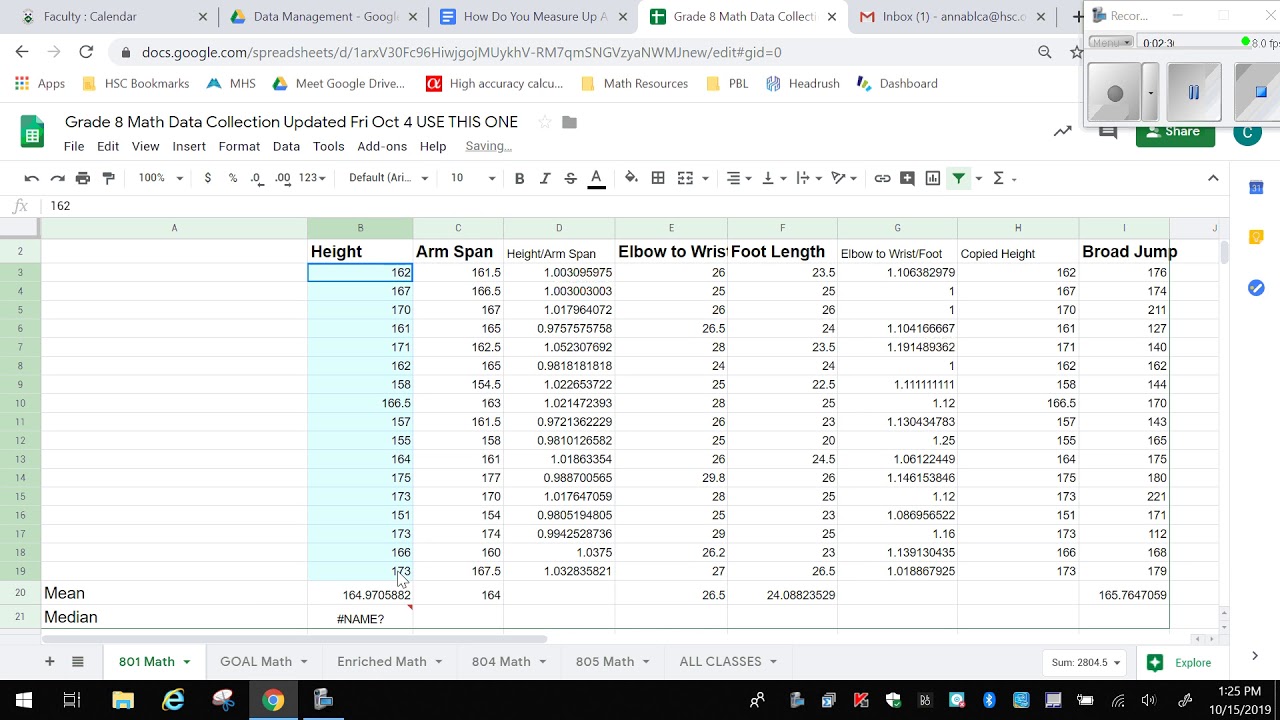
TLDRThis video demonstrates how to calculate the mean, median, mode, and range using Google Sheets. The instructor guides users through simple steps, starting with creating formulas to find these values. For mean, the 'average' function is used, while for median and mode, respective functions are directly applied. Calculating range involves manually subtracting the smallest value from the largest in the dataset. This method is useful for analyzing large datasets quickly and efficiently in both Google Sheets and Excel.

Takeaways

  • 📊 Use Google Sheets to calculate statistical measures like mean, median, mode, and range for large datasets.
  • 🔢 To calculate the mean, use the 'AVERAGE' function in Google Sheets by highlighting the data range and pressing enter.
  • ➗ For the median, use the 'MEDIAN' function, which finds the middle value in a dataset.
  • 🔝 The 'MODE' function identifies the number that appears most frequently in the data.
  • 📉 To find the range, subtract the smallest value from the highest value in the dataset.
  • 📋 There isn't a specific formula for range in Google Sheets; it needs to be calculated manually.
  • 📈 The script demonstrates how to use formulas in Google Sheets, similar to Excel, for data analysis.
  • 🔍 The video script is a tutorial for those who need to analyze practice test results or any numerical data.
  • 📝 Rounding off the mean to the second digit is suggested for better readability and presentation.
  • 👨‍🏫 The tutorial is aimed at helping viewers improve their data analysis skills for assessments or reports.

Q & A

  • What is the main purpose of the video?

    -The main purpose of the video is to demonstrate how to use Google Sheets to calculate mean, median, mode, and range for a set of data, which is particularly helpful for handling large datasets.

  • Why is using Google Sheets beneficial for calculating statistical measures?

    -Using Google Sheets is beneficial because it simplifies the calculation process for large datasets, which can be cumbersome to calculate manually, and it provides built-in functions for these statistical measures.

  • What is the first statistical measure discussed in the video?

    -The first statistical measure discussed in the video is the mean, which is calculated using the AVERAGE function in Google Sheets.

  • How does one calculate the mean in Google Sheets according to the video?

    -To calculate the mean in Google Sheets, one should use the AVERAGE function, select the range of data, and then press enter to get the result.

  • What is the difference between the mean and median?

    -The mean is the average of all the numbers in a dataset, while the median is the middle value when the numbers are arranged in ascending order.

  • How is the median calculated in Google Sheets?

    -The median is calculated in Google Sheets by using the MEDIAN function, selecting the range of data, and pressing enter.

  • What does the mode represent in a dataset?

    -The mode represents the number that appears most frequently in a dataset.

  • How does one find the mode in Google Sheets?

    -To find the mode in Google Sheets, one should use the MODE function, select the range of data, and then press enter.

  • What is the range in the context of statistical measures?

    -The range is the difference between the highest and lowest values in a dataset, indicating the spread of the data.

  • Why doesn't the video provide a formula for calculating the range in Google Sheets?

    -The video does not provide a formula for calculating the range because it is a simple calculation that involves identifying the highest and lowest values in the dataset and subtracting them.

  • What is the significance of calculating these statistical measures for an assessment?

    -Calculating statistical measures like mean, median, mode, and range is significant for an assessment as they provide insights into the central tendency and dispersion of the data, which are crucial for data analysis.

Outlines

00:00

📊 Calculating Mean, Median, Mode, and Range in Google Sheets

This video tutorial guides viewers on how to utilize Google Sheets for calculating the mean, median, mode, and range of a dataset. The presenter explains that while the process can be cumbersome with large datasets, Google Sheets can simplify these calculations. The video demonstrates how to create formulas using the 'AVERAGE' function for the mean, the 'MEDIAN' function for the median, and the 'MODE' function for the mode. For the range, the presenter instructs viewers to manually find the highest and lowest values and subtract them. The video uses a practice test results dataset as an example, showing step-by-step how to input the formulas and extract the required statistical measures. The presenter also emphasizes the importance of rounding the mean to two decimal places for clarity. The tutorial is beneficial for those who need to analyze data sets and understand the basic statistical measures.

Mindmap

Keywords

💡Google Sheets

Google Sheets is a web-based spreadsheet program that allows users to create, edit, and collaborate on spreadsheets in real-time. In the context of the video, it is used as a tool to calculate statistical measures like mean, median, mode, and range. The video demonstrates how to leverage Google Sheets' functions to perform these calculations efficiently, which is particularly useful for handling large datasets.

💡Mean

The mean, also known as the average, is a measure of central tendency that represents the sum of all values in a dataset divided by the number of values. In the video, the presenter shows how to calculate the mean using the 'AVERAGE' function in Google Sheets, which is a crucial step in analyzing data sets, as it provides an overall sense of the data's central value.

💡Median

The median is the middle value in a data set when the numbers are arranged in ascending or descending order. If there is an even number of observations, the median is the average of the two middle numbers. The video script mentions using the 'MEDIAN' function in Google Sheets to find this value, which is significant for understanding the central tendency of the data, especially when the data is skewed.

💡Mode

The mode is the value that appears most frequently in a data set. It is a measure of central tendency that can be used when the data set contains non-numeric values or is not normally distributed. In the video, the presenter demonstrates how to calculate the mode using the 'MODE' function in Google Sheets, highlighting its importance in identifying the most common occurrence in a dataset.

💡Range

The range in statistics refers to the difference between the highest and lowest values in a data set. It is a measure of dispersion or variability. The video script explains calculating the range manually by subtracting the smallest value from the largest, which is a straightforward method to understand the spread of the data.

💡Data Set

A data set is a collection of data points that are gathered for analysis. In the video, the data set consists of results from a practice test, and the presenter uses it to demonstrate how to calculate mean, median, mode, and range. Understanding the concept of a data set is fundamental to statistical analysis, as it forms the basis for all calculations and interpretations.

💡Formula

In the context of spreadsheets, a formula is an equation or statement that performs a calculation on one or more values in the spreadsheet. The video script describes using formulas such as '=AVERAGE', '=MEDIAN', and '=MODE' to calculate statistical measures. Formulas are essential for automating calculations and making data analysis more efficient and accurate.

💡Statistical Measures

Statistical measures are mathematical calculations that summarize and describe the characteristics of a data set. The video focuses on four common measures: mean, median, mode, and range. These measures are crucial for understanding the central tendency and dispersion of data, and the video provides practical examples of how to calculate them using Google Sheets.

💡Central Tendency

Central tendency refers to the center or typical value of a data set. The mean, median, and mode are all measures of central tendency. The video script discusses how to calculate these measures using Google Sheets, which helps to identify the 'average' value of the data and understand its overall trend.

💡Dispersion

Dispersion, or variability, refers to the spread of values in a data set. The range is a measure of dispersion, and the video script includes a step-by-step guide on how to calculate it. Understanding dispersion is important for assessing the consistency or variability of data, which can provide insights into the data's reliability and validity.

💡Collaboration

Collaboration in the context of Google Sheets refers to the ability for multiple users to work on the same spreadsheet simultaneously. Although not explicitly mentioned in the script, the video's theme of using Google Sheets implies the potential for collaborative data analysis, which is a key feature of cloud-based tools like Google Sheets.

Highlights

Using Google Sheets to calculate mean, median, mode, and range for large datasets.

The process can be replicated in Excel with similar functionality.

Calculating the mean by using the 'average' function in Google Sheets.

Highlighting the data range for the 'average' function to compute the mean.

Rounding the mean to the second decimal place for readability.

Calculating the median by using the 'median' function in Google Sheets.

Selecting the data range for the 'median' function to find the middle value.

Understanding that the median is the middle number in a data set.

Calculating the mode with the 'mode' function to find the most frequently occurring number.

Identifying the mode by highlighting the data range and using the 'mode' function.

Manually calculating the range by subtracting the smallest value from the highest.

Finding the smallest and highest values in the dataset to compute the range.

Using the formula 'highest value - lowest value' to determine the range.

The practical application of these calculations for data analysis in assessments.

The importance of accuracy when manually identifying the range to avoid errors.

The video provides a step-by-step guide on using Google Sheets for statistical calculations.

The video demonstrates how to use built-in functions in Google Sheets for data analysis.

The video explains the significance of each statistical measure in the context of data sets.

Transcripts

play00:01

okay in this video we're going to be

play00:02

looking at how we can use our Google

play00:04

Sheets uh to help us calculate mean

play00:07

median mode and range so uh what this

play00:11

will do is we'll hopefully calculate

play00:14

this for us um sometimes we we have

play00:16

large data sets as we will have in our

play00:18

test here it's hard to calculate these

play00:20

using Google Sheets will um definitely

play00:23

improve this for us so uh you can do the

play00:25

exact same thing as I'm doing here in

play00:27

Excel if you need to uh um it's there's

play00:30

not much of a difference but the the

play00:32

strategy is quite simple so we'll go

play00:33

through each one quickly and I'll show

play00:35

you how we can calculate this using

play00:37

Google Sheets so here we have a list of

play00:39

results from uh a practice test that we

play00:42

may have done um we want to be able to

play00:44

calculate the mean median mode and range

play00:46

using Excel here so all you need to do

play00:49

is simply uh create a formula so that

play00:52

will um give you your information so to

play00:54

do that you need to start with just by

play00:57

putting in a equal sign Sor it's a plus

play00:59

sign

play01:00

again a plus sign so we go equals um and

play01:03

then you want to type in what you want

play01:04

to find so here I want to find the mean

play01:07

and you'll notice that it doesn't come

play01:09

up so the best thing to look up is then

play01:11

average okay so I want to use the

play01:13

average here um I'll click on that and

play01:17

then it's going to ask me to give the uh

play01:19

data so all I do is highlight all this

play01:22

information here so I want from 42 down

play01:26

to

play01:27

21 you'll see up on the uh formula there

play01:31

it's got the set of data all I need to

play01:33

do is close the brackets press enter and

play01:37

that will give me my uh result there so

play01:39

as you can see here it's quite a big

play01:41

number all you need to do is just round

play01:42

that off to the uh second digit there um

play01:45

so that's how you calculate mean so

play01:47

instead of using mean just use average

play01:49

to calculate the median same thing equal

play01:52

sign you should be able to just type in

play01:54

median and it will come up there um it

play01:57

gives you your Open brackets so we just

play01:59

need to again highlight the key

play02:02

information I want to close those

play02:04

brackets enter I've got my median so

play02:07

remember that is the number that sits in

play02:09

the middle so 51 in this case is the

play02:12

median number on this data set mode m o

play02:16

the number that appears most often I

play02:18

want to find what that is equal sign

play02:21

I'll type in mode and that will come up

play02:23

as it says there most commonly occurring

play02:25

value click on mode opens by

play02:28

brackets select the

play02:32

data and then simply close the brackets

play02:35

and enter so the mode the number that

play02:37

appears the most is 49 now to find range

play02:40

it's uh slightly different it doesn't

play02:42

necessarily have a formula so you're

play02:43

going to have to do this simply yourself

play02:45

so to find again the range it's the

play02:48

highest new um value minus the smallest

play02:53

so you can either just scroll through

play02:55

and find that yourself if you are

play02:57

confident enough as long as you don't

play02:59

make um C an error so I've got 42 at the

play03:03

moment as the lowest so if I have 42 let

play03:06

me see if there's anything lower than

play03:09

42 doesn't look like that is right so 42

play03:13

is my lowest number and my highest

play03:15

number is so we got 51 there

play03:18

58

play03:22

61 got

play03:25

62 and 62 is my second high so I have um

play03:30

I could just put

play03:32

62 minus 42 enter and that will give me

play03:37

my answer right there so in this case

play03:39

I'll use 20 as the range okay so that's

play03:42

how you can find the mean median mode

play03:45

and range using Google Sheets this will

play03:47

be very helpful for your assessment um

play03:49

and then we'll be able to once you've

play03:50

done that for each of the sections we'll

play03:52

then be able to go on and analy that

play03:54

data

Rate This

5.0 / 5 (0 votes)

Ähnliche Tags
Data AnalysisGoogle SheetsMean CalculationMedian CalculationMode CalculationRange CalculationStatistical ToolsExcel TipsEducational VideoTest ResultsPractice Test
Benötigen Sie eine Zusammenfassung auf Englisch?