IIMFC2022016-V006400

FC201.2x
23 Aug 201614:01

Summary

TLDRThis script delves into the concept of duration gap analysis, a critical tool for financial institutions to assess their exposure to interest rate risks. It explains the process of calculating the market value of equity and the weighted average duration of assets and liabilities. The example provided illustrates how a 1% change in interest rates can significantly impact the market value of a firm's equity, emphasizing the importance of this analysis for understanding and managing financial risk.

Takeaways

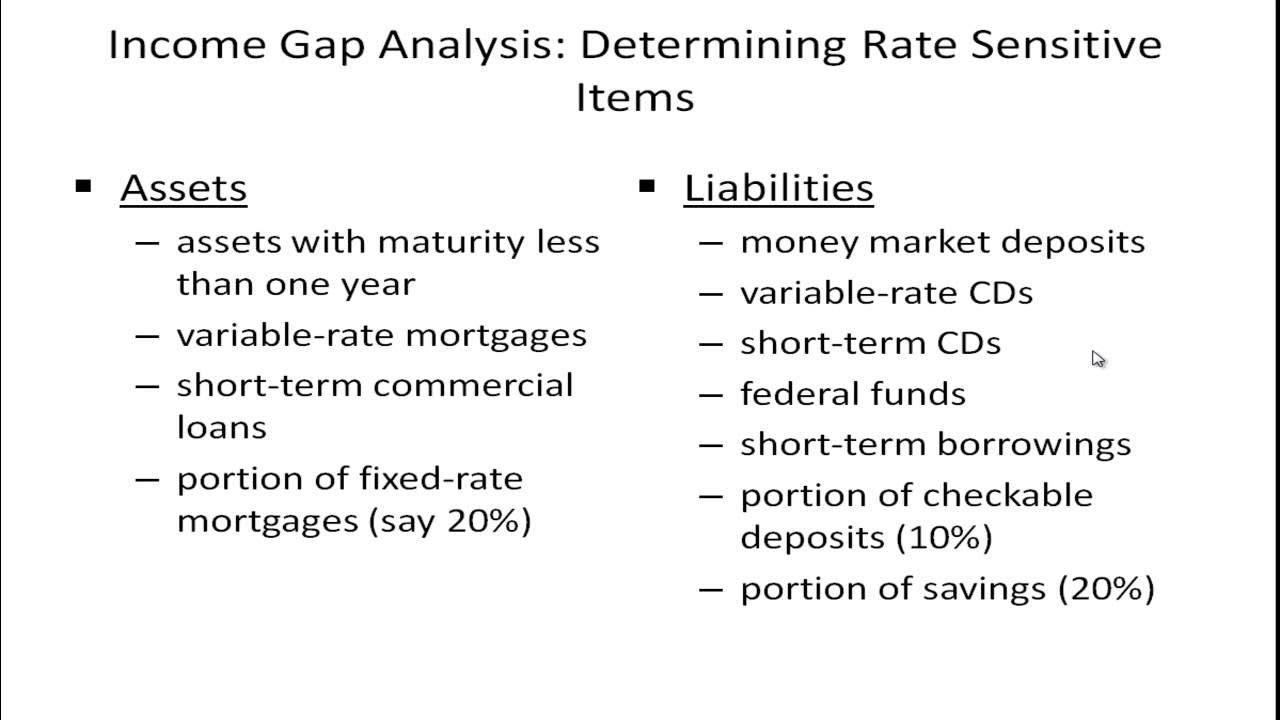
  • 📊 Duration Gap Analysis is a method to measure a bank's exposure to interest rate risks, focusing on the sensitivity of the market value of its equity to interest rate movements.
  • 🏦 The market value of equity is calculated by multiplying the number of equity shares issued by the firm by the market price per share.
  • 📈 The process involves three main steps: bucketing risk-sensitive assets and liabilities, computing the modified duration of these assets and liabilities, and assessing the impact on net interest income and market value of the firm when interest rates change.
  • 📋 Duration is a key concept in this analysis, representing the weighted average time to receive the present value of cash flows from an asset or liability.
  • 📉 The duration of an asset or liability is calculated by multiplying the present value of cash flows by the time period and dividing by the market value of the asset or liability.
  • 💹 The weighted average duration for assets and liabilities is used to calculate the duration Gap, which indicates the bank's overall interest rate risk exposure.
  • 📝 The net interest income is derived from the interest earned on assets and the interest paid on liabilities, reflecting the bank's profitability from interest rate spreads.
  • 📉 An increase in interest rates will generally decrease the market value of assets with longer durations more significantly than those with shorter durations.
  • 📈 A decrease in the duration Gap indicates a reduction in the bank's interest rate risk exposure, as the weighted average duration of assets becomes more aligned with that of liabilities.
  • 💡 Duration Gap Analysis is a valuable tool for financial institutions to manage interest rate risk and is often a mandatory reporting requirement by central banks.
  • 🌐 The impact of interest rate changes on a bank's market value of equity can be substantial, affecting stakeholders and investors' confidence in the institution.

Q & A

  • What is duration Gap analysis in the context of a financial institution?

    -Duration Gap analysis is a method used to measure the sensitivity of a bank's market value of equity to changes in interest rates. It assesses the bank's exposure to interest rate risks by examining the impact of interest rate movements on the market value of its equity.

  • What are the steps involved in performing a duration Gap analysis?

    -The steps in duration Gap analysis include: 1) Bucketing all risk-sensitive assets and liabilities based on residual maturity or repricing dates into various time bands, 2) Computing the modified duration of the risk-sensitive assets and liabilities, and 3) Using these measures to assess the impact on net interest income and the market value of the firm when interest rates change.

  • How is the market value of equity calculated?

    -The market value of equity is calculated by multiplying the number of equity shares issued by the firm by the market price per share. It reflects the current market price at which the firm's shares are trading.

  • What is the significance of the 'duration' column in the spreadsheet example?

    -The 'duration' column is fundamental to duration Gap analysis. It represents the sensitivity of the market value of the assets and liabilities to changes in interest rates, and it is used to determine the potential impact of interest rate changes on the financial institution.

  • Can you explain how the duration of a financial instrument is calculated?

    -The duration of a financial instrument is calculated by summing the present value of each cash flow, multiplied by the time period it is received, and then dividing this sum by the total present value of all cash flows. This gives a weighted average time to receipt of cash flows, which is the duration.

  • What is the purpose of calculating the weighted average duration for assets and liabilities?

    -The weighted average duration for assets and liabilities helps to determine the overall sensitivity of a financial institution's balance sheet to interest rate changes. It provides a measure of how much the net interest income and market value of equity might change with a shift in interest rates.

  • How is the net interest income calculated in the context of duration Gap analysis?

    -Net interest income is calculated by taking the interest income from assets, such as loans and bonds, and subtracting the interest expenses on liabilities, such as deposits. The rates used are the current market rates, and the calculation takes into account the market values of these financial instruments.

  • What is the duration Gap, and how is it calculated?

    -The duration Gap is the difference between the weighted average duration of risk-sensitive assets and the weighted average duration of risk-sensitive liabilities. It is calculated by subtracting the duration of liabilities (adjusted for their market value as a proportion of total assets) from the duration of assets.

  • What impact does a change in interest rates have on the market value of equity according to the duration Gap analysis?

    -A change in interest rates affects the market value of equity inversely to the duration Gap. If interest rates rise, and the duration Gap is positive (assets have a longer duration than liabilities), the market value of equity will decrease, and vice versa.

  • Why is duration Gap analysis important for financial institutions and their stakeholders?

    -Duration Gap analysis is important because it helps financial institutions manage and communicate the risk associated with interest rate fluctuations. It provides stakeholders with insights into how sensitive the institution's profitability and equity value are to changes in the interest rate environment.

  • How might central banks use duration Gap analysis in their regulatory framework?

    -Central banks may mandate the inclusion of duration Gap analysis in financial reporting requirements to ensure that financial institutions are transparent about their interest rate risk exposure. This allows regulators and investors to assess the institution's risk profile and financial stability.

Outlines

00:00

📊 Duration Gap Analysis Fundamentals

This paragraph introduces the concept of Duration Gap analysis, a method used to assess a bank's exposure to interest rate risks. It explains how the market value of equity is calculated and how the analysis involves three main steps: bucketing risk-sensitive assets and liabilities, computing the modified duration of these assets and liabilities, and estimating the impact on net interest income and the market value of the firm due to interest rate changes. A spreadsheet example is used to illustrate the calculation of duration for different financial instruments like CDs, commercial loans, and treasury bonds, emphasizing the importance of duration in assessing interest rate risk.

05:03

📉 Impact of Interest Rate Changes on Duration and Equity Value

This section delves into the weighted average duration calculation for both assets and liabilities, and how it affects the net interest income. It also explains the concept of the duration Gap, which is the difference between the weighted average duration of assets and liabilities. The paragraph presents a hypothetical scenario where a 1% increase in interest rates impacts various financial instruments differently, based on their duration. It demonstrates how this change affects the market value of assets and liabilities, ultimately leading to a decrease in the market value of equity for the financial institution. The summary highlights the importance of understanding the sensitivity of a firm's equity to interest rate fluctuations.

10:07

🏦 Duration Gap Analysis in Financial Regulation

The final paragraph discusses the practical application of Duration Gap analysis in the financial industry, emphasizing its importance in regulatory compliance. It mentions that several central banks mandate the inclusion of Duration Gap analysis in financial reporting to ensure stakeholders are informed about the institution's exposure to interest rate risks. The paragraph concludes with an example of how a 1% interest rate increase can significantly impact the market value of equity, illustrating the substantial effect of interest rate changes on a financial institution's valuation.

Mindmap

Keywords

💡Duration Gap Analysis

Duration Gap Analysis is a financial tool used to measure a bank's exposure to interest rate risk by assessing the sensitivity of the market value of its equity to changes in interest rates. It is central to the video's theme as it is the main method discussed for evaluating interest rate risk. The script explains how it involves bucketing risk-sensitive assets and liabilities, computing their modified durations, and then using these measures to predict the impact on net interest income and market value of equity when interest rates fluctuate.

💡Market Value of Equity

The market value of equity refers to the total value of a firm's outstanding shares of stock at the current market price. It is a key concept in the video, as the changes in this value due to interest rate movements are the primary focus of duration gap analysis. The script clarifies that this is calculated by multiplying the number of equity shares by the market price per share and is used to illustrate the financial impact of interest rate changes on a firm's equity value.

💡Risk-Sensitive Assets and Liabilities

Risk-sensitive assets and liabilities are financial instruments whose cash flows are affected by changes in interest rates. In the context of the video, these are the components that are 'bucketed' and analyzed in the duration gap analysis. The script provides examples such as CDs, commercial loans, and treasury bonds, which are categorized based on their repricing dates into different time bands to assess their interest rate risk.

💡Modified Duration

Modified duration is a measure used to calculate the sensitivity of a bond's price to changes in interest rates. It is a critical component in the video's explanation of duration gap analysis. The script demonstrates how to calculate the modified duration for different financial instruments, such as CDs, commercial loans, and treasury bonds, by multiplying the present value of cash flows by the time period and dividing by the bond's market value.

💡Net Interest Income

Net interest income is the difference between the interest income earned on a bank's assets and the interest expenses paid on its liabilities. It is a key financial metric in the video, as changes in this income due to interest rate fluctuations are a direct result of the duration gap. The script shows how to calculate net interest income by applying interest rates to the market values of assets and liabilities and then adjusting for the duration gap.

💡Weighted Average Duration

Weighted average duration is the average duration of a portfolio of financial instruments, weighted by their market values. It is used in the video to summarize the overall interest rate risk of a bank's assets and liabilities. The script illustrates the calculation by summing the products of market values and durations for each instrument, then dividing by the total market value of the portfolio.

💡Interest Rate Risk

Interest rate risk is the risk that the value of a firm's fixed-income securities will decline due to a rise in market interest rates. The video discusses this risk extensively, explaining how duration gap analysis helps financial institutions understand and manage this risk. The script provides a scenario where a 1% increase in interest rates impacts the market value of equity, demonstrating the practical implications of interest rate risk.

💡Yield to Maturity (YTM)

Yield to maturity, or YTM, is the total return anticipated on a bond if it is held until it matures. It is a fundamental concept in the video's discussion of bond valuation and duration calculation. The script uses YTM to calculate the present value of cash flows for various financial instruments, showing how changes in YTM affect their market values and durations.

💡Macroeconomic Context

The macroeconomic context refers to the economic environment in which financial institutions operate, including factors such as interest rates, inflation, and economic growth. The video uses a change in the macroeconomic context to illustrate how a 1% increase in interest rates affects the duration gap and the market value of equity. This concept is essential for understanding the external factors that can influence a bank's financial performance.

💡Financial Reporting Requirements

Financial reporting requirements are the mandatory standards and guidelines that financial institutions must follow when presenting their financial statements. The video mentions that several central banks have mandated the inclusion of duration gap analysis in these reports. This highlights the importance of transparently communicating a bank's exposure to interest rate risk to stakeholders.

Highlights

Duration Gap analysis measures a bank's exposure to interest rate risks by assessing the sensitivity of the market value of equity to interest rate movements.

Market value of equity is calculated as the number of equity shares multiplied by the market price per share.

The process involves bucketing risk-sensitive assets and liabilities based on repricing dates into various time bands.

Computing the modified duration of both risk-sensitive assets and liabilities is a key step in the analysis.

The impact of interest rate changes on net interest income and the market value of the firm is measured using duration Gap.

A spreadsheet example illustrates the balance sheet of a financial institution with rate-sensitive assets and liabilities.

Duration is fundamental to Duration Gap analysis and is calculated for each financial instrument.

The duration calculation for a 3-year CD involves present value of cash flows and the face value realized at maturity.

Duration is computed by multiplying the present value of cash flows by the year and dividing by the market value.

The weighted average duration for assets and liabilities is calculated to determine the duration Gap.

Net interest income is derived from the interest earned on assets and paid on liabilities.

The duration Gap is calculated by subtracting the weighted average duration of liabilities from that of assets.

Equity is the residual market value after accounting for risk-sensitive liabilities.

A scenario analysis demonstrates the impact of a 1% interest rate increase on the financial institution's market value.

The change in interest rates affects the duration and market value of securities, with longer durations experiencing greater impacts.

An increase in interest rates results in a decrease in the market value of assets and equity for the financial institution.

Duration Gap analysis is a crucial tool for financial institutions to understand and manage interest rate risk.

Several central banks mandate the inclusion of Duration Gap analysis in financial reporting to inform stakeholders of interest rate risk sensitivity.

Transcripts

play00:05

duration Gap analysis measures the level

play00:09

of A bank's exposure to interest rate

play00:13

risks in terms of the

play00:16

sensitivity of the market value of its

play00:19

Equity to movements in interest rates

play00:22

please recall market value of equity is

play00:26

the number of equity shares issued by

play00:28

the firm multiplied by the market price

play00:33

per share duration Gap analysis involves

play00:37

the following steps one bucketing all

play00:42

risk sensitive assets and risk sensitive

play00:46

liabilities exactly as in the repricing

play00:49

Gap analysis based on the residual

play00:53

maturity or repricing dates in the

play00:56

various time bands step number two

play01:00

Computing the mol

play01:02

duration of the risk sensitive assets

play01:06

and risk sensitive liabilities and step

play01:09

number three using the above measure the

play01:13

impact on the net interest income the

play01:17

duration Gap and most importantly the

play01:20

market value of the firm when interest

play01:23

rates change let's look at a spreadsheet

play01:26

example to understand this in detail so

play01:30

what we have here is a condensed balance

play01:33

sheet of a financial

play01:37

institution reflecting essentially the

play01:40

assets and liabilities which are rate

play01:44

sensitive and what is also shown here is

play01:47

not the book value of the assets and the

play01:50

book value of liabilities but it is the

play01:52

market value of assets and the market

play01:55

value of liabilities as already

play01:58

explained earlier market value is the

play02:01

price at which these instruments are

play02:03

quoting in the market what you will also

play02:06

notice is a column called

play02:08

duration and this is fundamental to

play02:11

duration Gap analysis we will see how

play02:15

this duration is computed and what is

play02:17

its role in determining interest rate

play02:20

risk let's go through how this duration

play02:23

is calculated let's take this threeyear

play02:27

CDs the market value of this CD is 300

play02:31

and the interest rate is 7% now what you

play02:34

will see here is the duration

play02:37

calculation for this CDs so what we have

play02:41

here is the cash flows at 7% for 3 years

play02:46

plus the face value which will be

play02:49

realized at the end of the three years

play02:51

and if you compute the present value of

play02:53

these cash flows remember the coupon is

play02:57

7% and the eeld to mature it is also 7%

play03:01

so when you compute the present value of

play03:03

the cash flows it should add up to 300

play03:07

now to calculate duration what you do is

play03:11

you take this figure multiply by the

play03:15

year which is what is reflected in this

play03:17

column so how did we arrive at

play03:20

36.6 it is 18.34%

play03:29

ated

play03:31

as this figure divided by this figure

play03:36

which in this case works out to

play03:40

2.88 we've done exactly the same thing

play03:43

for the six-year commercial loans the

play03:45

six-year commercial loans is 700 at 12%

play03:49

and what you see here is the cash flows

play03:52

700 into 12% every year for 6 years and

play03:56

the face value of 700 and you compute

play03:58

the present value of those cash flows

play04:00

the total should come up to 700 because

play04:03

the yield to maturity at this point in

play04:05

time is equal to the coupon rate of 12%

play04:10

and finally the 10year treasury bonds we

play04:14

do exactly the same arithmetic at 8% on

play04:18

200 cash flows of 16 for 10 years at the

play04:21

end of the 10th year the face value of

play04:23

200 would be realized the present value

play04:27

would be also 200 because YTM is 8% and

play04:32

the coupon rate is also 8% and the

play04:35

duration is calculated exactly as we did

play04:38

before which is multiply the year into

play04:42

the present value of the cash flow and

play04:44

the total of that works out to as you

play04:47

can see 1449 38 that 14 49.38.07

play04:59

7 years so what we have transcribed here

play05:02

is this

play05:04

2.88 for the 3E CDs the

play05:07

4.65 which is the duration for these

play05:10

commercial loans and 7.24 7 which is the

play05:13

duration for the 10-year treasury bonds

play05:17

what you have here is the weighted

play05:18

average of the duration for the

play05:20

liabilities and the Assets Now how did

play05:22

we calculate that it is uh 100 into the

play05:26

duration cash duration is zero 700

play05:30

into

play05:31

4.65 + 200 into 7.24 7 divided by 1,00

play05:38

would give you a figure of

play05:41

4673 and this weighted average duration

play05:44

is also computed in exactly the same

play05:47

manner also important to note the net

play05:50

interest income therefore is 700 into

play05:53

12% plus 200 into 8% minus 620 into 5%

play06:00

minus 300 into 7% That's how we arrived

play06:04

at this figure of 48 and the duration

play06:08

Gap let me explain this duration

play06:10

calculation to you we have 4.67 3 years

play06:14

on a total assets of 1,000 whereas this

play06:20

1.59 is on a total assets of of

play06:23

920 so in order for us to compute like

play06:26

for like we need to take the duration

play06:29

Gap we we start with 4.67 3 which is the

play06:34

weighted average of the duration for the

play06:37

risk sensitive assets minus

play06:41

1.59 into

play06:44

920 divided by 1,000 because remember

play06:48

the risk sensitive liabilities are only

play06:51

920 and therefore this 1.59 needs to be

play06:54

adjusted in order to be able to do a

play06:57

realistic subtraction and that gives you

play07:00

a weighted average duration of

play07:04

3.21 the other point to bear in mind and

play07:06

I'm going to come back to this again a

play07:08

little later the equity is the market

play07:11

value of equity which is total assets

play07:15

1,000 so by the law of accounting we

play07:17

should have total liabilities also equal

play07:20

to 1,000 but the risk sensitive

play07:23

liabilities total up only to

play07:26

920 and therefore the mark market value

play07:30

of equity is the residue which is 1,

play07:34

minus

play07:35

920 what we have summarized here is what

play07:39

we saw in the previous spreadsheet the

play07:41

weighted average duration for the assets

play07:43

was 4.67 3 and the weighted average

play07:46

duration for the liabilities is

play07:50

1.59 and the net interest income was 48

play07:54

and the market value of equity was 80

play07:56

now here's a scenario where let us say

play07:59

the macroeconomic context in the country

play08:01

changes and as a result the interest

play08:04

rate on all risk sensitive assets and

play08:07

liabilities would change for ease of

play08:10

understanding I have assumed an interest

play08:12

rate change of 1% so onee time deposits

play08:16

the interest rate now goes up from 5% to

play08:19

6% threee CDs it goes up from 7% to 8%

play08:23

six-year commercial loans goes up from

play08:25

12% to 133% and 10e treasury bonds goes

play08:29

up from from 8% to 9% the Assumption

play08:31

we've made here is all the changes in

play08:34

interest rates are equal that's to make

play08:37

our life simple in this example in the

play08:39

real world they do not go up by exactly

play08:42

the same proportion let us see what this

play08:45

one% rate change does to our duration

play08:49

and therefore to the market value of

play08:51

equity of this financial institution if

play08:54

you look at this computation threee CDs

play08:58

remember earlier it was 300 so why did

play09:02

it drop from 300 to

play09:04

292.00 it's fairly straightforward the

play09:07

cash flows that means the coupon on

play09:10

these CDs is 7% so on 300 it is 21 each

play09:14

year the YTM now is 8% and therefore the

play09:18

present value of the cash flows would be

play09:21

computed as shown in this column and the

play09:24

total of that works out to

play09:28

29227 and in the duration computation we

play09:31

do exactly what we did before which is

play09:34

multiply the present value into the

play09:37

number of years and the total of that

play09:39

works out to

play09:42

8199 and if you now calculate the

play09:44

duration for the CDs it is

play09:47

8199 divided by

play09:53

292.00 five years the point to note here

play09:56

is with the 1% increase in interest

play09:58

rates the duration which was earlier

play10:02

2.88 has now come down to

play10:06

2.85 and more importantly if you take

play10:09

the 10year treasury bonds using exactly

play10:12

the same logic the cash flows at 8% were

play10:15

16 on 200 for a period of 10 years the

play10:19

present value would now be because the

play10:23

coupon was 8% and the YTM is now 9% the

play10:28

present value of the cash flows will now

play10:30

add up to

play10:31

1887 and the duration computed would

play10:35

change to

play10:39

7146 which was

play10:42

7247 earlier now please note because the

play10:46

T bonds have a maturity of 10 years the

play10:50

change in the duration is much more than

play10:54

for example the change in the duration

play10:57

in the case of the 3year CD

play10:59

remember what we learned earlier longer

play11:02

the duration more will be the impact on

play11:06

the market value of the Securities you

play11:09

will also notice that with these change

play11:11

in interest rates the net interest

play11:14

income would come down to

play11:17

47800 more importantly if you look at

play11:20

the weighted average duration it has

play11:22

come down from

play11:24

1.59 to 1.57 eight and the weighted

play11:28

average duration of the asset has come

play11:30

down from 4.67 3 to

play11:36

4599 and the duration Gap as a

play11:39

consequence has come down from 3.21 0 to

play11:46

3.98 most important and this is where we

play11:50

study the impact of interest rate risk

play11:52

on the market value of the firm the

play11:55

market value of assets have dropped to

play11:57

9591

play11:59

18 but if you look at the market value

play12:02

of the risk sensitive liabilities it

play12:05

totals up only to

play12:29

market value of the equity falling from

play12:31

80 to

play12:34

46.9 so if you we an equity stockholder

play12:38

in this financial institution you will

play12:40

find this 1% increase in interest rate

play12:44

has hurt the market value of your Equity

play12:47

by substantial amount moving from 80 to

play12:54

4691 so as we saw in that spreadsheet

play12:57

example duration Gap analysis helps us

play13:01

determine the magnitude of change in the

play13:05

net interest income and more importantly

play13:10

the market value of equity when interest

play13:13

rates change this methodology would

play13:16

apply equally effectively to any

play13:19

financial

play13:21

institution several central banks around

play13:23

the world have mandated financial

play13:26

institutions under their jurisdiction to

play13:30

include duration Gap analysis as part of

play13:33

the mandatory financial reporting

play13:36

requirements in order that the

play13:38

stakeholders of that financial

play13:40

institution are made aware of the

play13:43

sensitivity of interest rate risks on

play13:47

the market price of that institution's

play13:51

Equity stock price

play13:56

[Music]

Rate This

5.0 / 5 (0 votes)

الوسوم ذات الصلة
Interest RatesFinancial RiskDuration GapMarket ValueEquity SensitivityAsset LiabilityRisk ManagementFinancial AnalysisEconomic ContextRegulatory Compliance
هل تحتاج إلى تلخيص باللغة الإنجليزية؟