Ukuran Pemusatan Data Modus Median dan Rata rata
Summary
TLDRIn this educational video, Pak Bangkit teaches students about measures of central tendency, focusing on mode, median, and mean (average). Through practical examples, he demonstrates how to calculate these values using datasets, such as test scores. The video explains the process of finding the mode (most frequent value), median (middle value), and mean (average), along with step-by-step instructions for each. The lesson is designed to help students confidently determine these values in various datasets. Pak Bangkit encourages students to practice and seek help if needed, ensuring a thorough understanding of the topic.
Takeaways
- 😀 Modus is the value that appears most frequently in a data set. For example, the most frequent grade in a class test determines the modus.
- 😀 To find the modus, list the frequencies of each data point and identify the one with the highest frequency. For instance, the grade 80 was the most frequent in a given data set.
- 😀 Median is the middle value of a data set when arranged in ascending order. If the number of data points is odd, it's the middle one. If even, it’s the average of the two middle values.
- 😀 For an odd data set, the median can be calculated using the formula (n + 1) / 2, where n is the total number of data points.
- 😀 If the data set is even, find the two middle values, sum them, and divide by two to determine the median.
- 😀 To determine the median from a data set, first sort the data, then cross out the first and last numbers until you find the middle one(s).
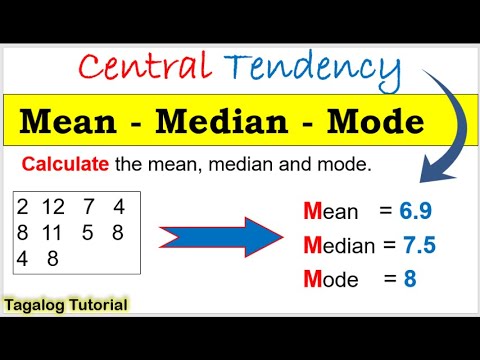
- 😀 In an even data set with values like 7 and 8 in the center, the median is calculated as (7 + 8) / 2 = 7.5.
- 😀 For a grouped data set, you can calculate the median using cumulative frequency tables, where you identify the median class using cumulative frequencies.
- 😀 The formula for the median in a grouped data set is based on finding the midpoint between the cumulative frequencies that correspond to the middle values.
- 😀 The mean (average) is found by summing all data values and dividing by the number of data points, giving you a single central value of the data set.
- 😀 When calculating the mean for grouped data, multiply each value by its frequency, sum those products, and then divide by the total frequency to get the average.
Q & A
What is the definition of mode in statistics?
-The mode is the data point that appears most frequently in a dataset. It is the value with the highest frequency or occurrence.
How do you determine the mode from a frequency table?
-To determine the mode, identify the data point with the highest frequency in the table. The corresponding value of that frequency is the mode.
What does 'median' refer to in statistical analysis?
-The median is the middle value of a dataset when the values are arranged in ascending order. For an odd number of data points, it is the middle value, and for an even number, it is the average of the two middle values.
How do you calculate the median for an odd number of data points?
-For an odd number of data points, the median is the value at the position (n + 1) / 2, where n is the total number of data points.
What is the procedure for finding the median of an even-numbered dataset?
-For an even-numbered dataset, you find the two middle values, sum them, and divide by 2 to get the median.
How do you calculate the median using cumulative frequency?
-To calculate the median using cumulative frequency, find the value that corresponds to the cumulative frequency that reaches or exceeds half the total number of data points.
What is the formula for calculating the mean (average) of a dataset?
-The mean is calculated by summing all the data points and dividing by the total number of data points. The formula is: Mean (X̄) = (X1 + X2 + X3 + ... + Xn) / n.
How do you calculate the mean when the data is presented in a frequency table?
-When data is in a frequency table, multiply each data point by its corresponding frequency, sum these products, and then divide by the total frequency to find the mean.
What is the key difference between the mode, median, and mean?
-The mode represents the most frequent data point, the median represents the middle value of the ordered dataset, and the mean is the average of all data points.
Why is it important to understand the different measures of central tendency?
-Understanding these measures helps to analyze and summarize data effectively. Each measure provides different insights into the distribution and central value of the data, making them essential tools for decision-making and statistical analysis.
Outlines

هذا القسم متوفر فقط للمشتركين. يرجى الترقية للوصول إلى هذه الميزة.
قم بالترقية الآنMindmap

هذا القسم متوفر فقط للمشتركين. يرجى الترقية للوصول إلى هذه الميزة.
قم بالترقية الآنKeywords

هذا القسم متوفر فقط للمشتركين. يرجى الترقية للوصول إلى هذه الميزة.
قم بالترقية الآنHighlights

هذا القسم متوفر فقط للمشتركين. يرجى الترقية للوصول إلى هذه الميزة.
قم بالترقية الآنTranscripts

هذا القسم متوفر فقط للمشتركين. يرجى الترقية للوصول إلى هذه الميزة.
قم بالترقية الآنتصفح المزيد من مقاطع الفيديو ذات الصلة
Mean, Median and Mode in Statistics | Statistics Tutorial | MarinStatsLectures
Grade 8 Measure of central tendency: Mean, median, mode for ungrouped data week 1 #math8 #matatag

Statistika 1 ~ Ukuran Pemusatan Data (Mean/Rata-Rata, Median, Modus) ~ Materi PJJ Kelas VIII / 8 SMP
Statistika - Ukuran Pemusatan Data (Mean, Median, Modus)

2ª SÉRIE - ENS. MÉDIO - FASE 13 - DESAFIO CRESCER - MATEMÁTICA

Statistics: The average | Descriptive statistics | Probability and Statistics | Khan Academy
5.0 / 5 (0 votes)
