Cara Uji Validitas dan Reliabilitas kuesioner penelitian menggunakan aplikasi SPSS
Summary
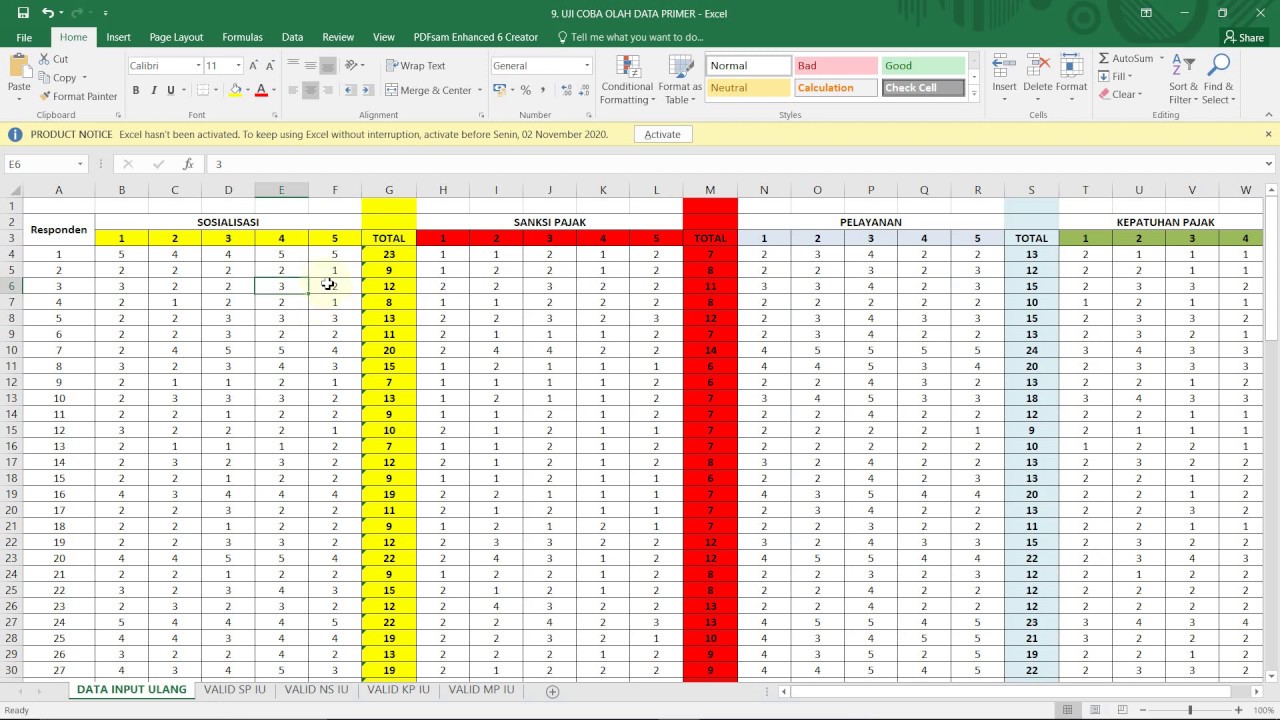
TLDRThis tutorial provides a detailed guide on conducting validity and reliability testing using SPSS. It walks through the process of preparing data with three variables (X1, X2, and Y) and 29 respondents. The tutorial explains how to test the validity of each item by comparing correlation coefficients, and how to assess reliability using Cronbach's Alpha. The tutorial is perfect for those looking to understand the steps involved in validating and ensuring the consistency of their research data with SPSS, ensuring a solid foundation for further analysis.
Takeaways
- 😀 Validity testing checks whether each item in a questionnaire is valid and can be used for research.
- 😀 In SPSS, the correlation coefficient (R) for each item is compared with the critical value from the R-table to determine validity.
- 😀 If the calculated R value for an item is greater than the R-table value, the item is considered valid.
- 😀 The formula for calculating the degree of freedom (df = n - 2) is used to find the critical R-table value, where n is the number of respondents.
- 😀 Validity can also be assessed using significance values: if the p-value is less than 0.05, the item is valid.
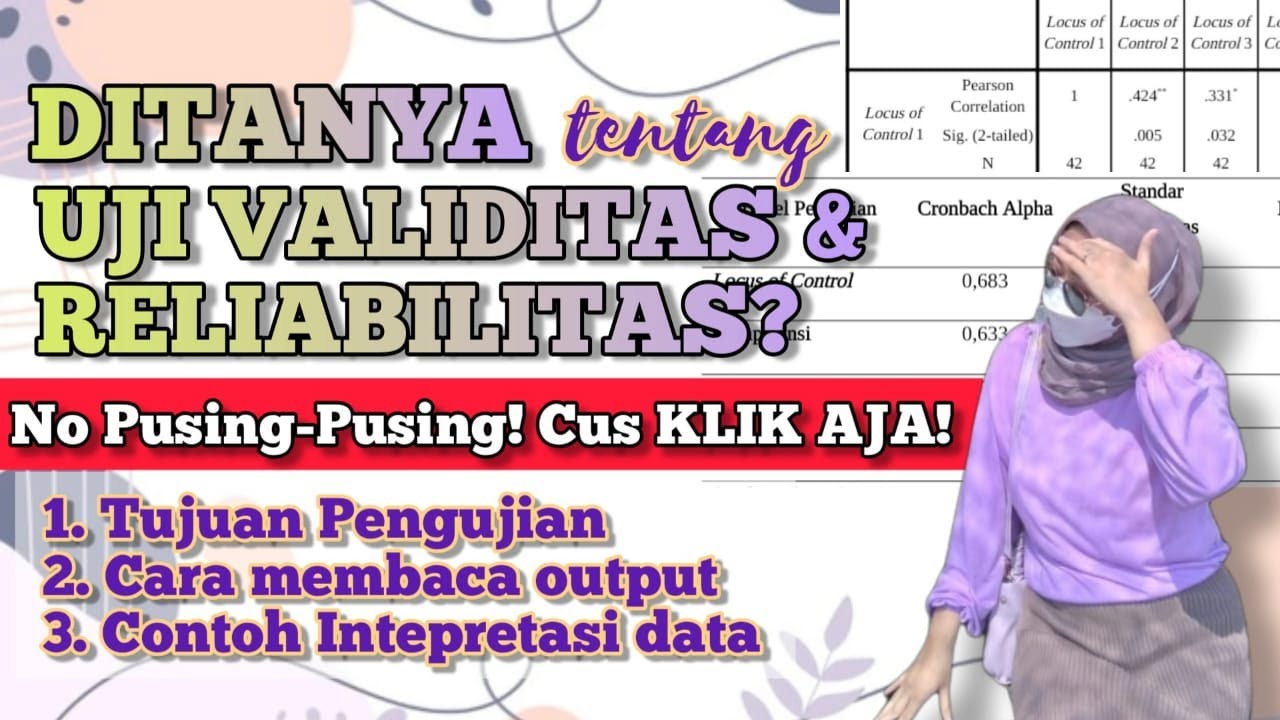
- 😀 For reliability testing, **Cronbach's Alpha** is used to measure the internal consistency of the items in a variable.
- 😀 A **Cronbach's Alpha** value greater than 0.6 indicates that the scale or variable is reliable and consistent.
- 😀 SPSS generates **Cronbach’s Alpha** for each variable (e.g., X1, X2, Y), which helps assess the consistency of survey items across all respondents.
- 😀 Data for each variable is entered into SPSS, and the process of validity and reliability testing is performed iteratively for each set of items.
- 😀 The tutorial provides a hands-on approach by showing how to input data, calculate R-values, and interpret Cronbach’s Alpha to ensure the survey's validity and reliability.
- 😀 The key takeaway is that validity ensures each item is measuring what it is supposed to measure, while reliability ensures the items consistently measure the same construct over time.
Q & A
What is the main purpose of the video tutorial?
-The video tutorial aims to explain how to perform validity and reliability testing using SPSS for research data.
How many variables and respondents are used in the example data?
-The example data includes three variables (X1, X2, and Y) and 29 respondents.
What is the purpose of validity testing in research?
-Validity testing is used to determine whether each questionnaire item accurately measures what it is intended to measure.
How do you decide if an item is valid according to the tutorial?
-An item is considered valid if its R-value (correlation coefficient) is greater than the R-table value or if the significance value is less than 0.05.
How is the R-table value determined for the validity test?
-The R-table value is determined using the number of respondents minus two as the degree of freedom and a significance level, commonly 0.05.
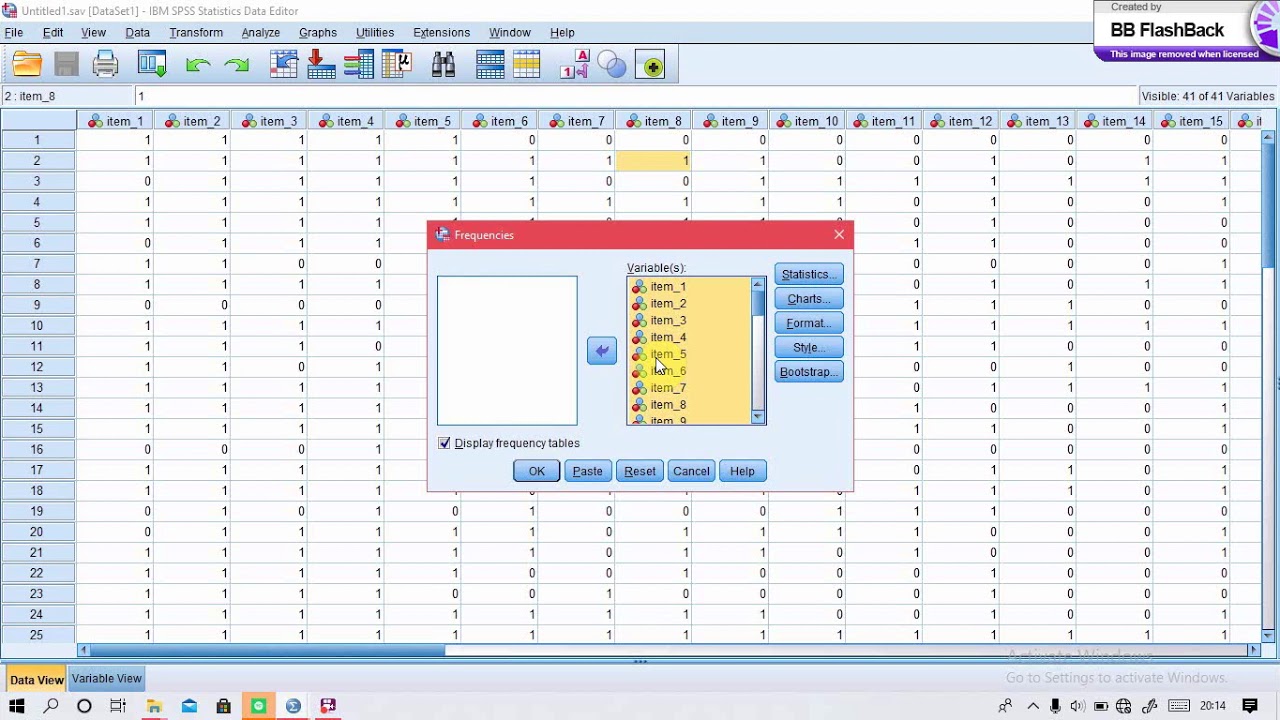
What SPSS steps are used to input and analyze the data for validity?
-First, enter the questionnaire responses in Data View, assign variable names in Variable View, then use the 'Correlation' analysis to calculate R-values for each item.
What is the significance of the significance value in validity testing?
-If the significance value is less than 0.05, the item is considered valid. If it is greater than 0.05, the item is not valid.
What is the purpose of reliability testing according to the video?
-Reliability testing assesses the consistency of questionnaire items, determining if they can produce stable and consistent results.
Which reliability coefficient is used in the tutorial, and what is the acceptable threshold?
-The tutorial uses Cronbach's Alpha as the reliability coefficient, with an acceptable threshold of 0.6 or higher for the items to be considered consistent.
How do you perform reliability testing in SPSS?
-Reliability testing in SPSS involves selecting 'Reliability Analysis', entering all item variables, and checking the Cronbach's Alpha value to assess consistency.
Can validity and reliability tests be applied to multiple variables simultaneously?
-Yes, the tutorial demonstrates that you can perform these tests for multiple variables, but each variable’s items must be analyzed separately for accuracy.
What conclusion can be drawn if all items for X1, X2, and Y are valid and reliable?
-If all items are valid and reliable, the questionnaire is consistent, measures what it is intended to, and is suitable for use in research.
Outlines

هذا القسم متوفر فقط للمشتركين. يرجى الترقية للوصول إلى هذه الميزة.
قم بالترقية الآنMindmap

هذا القسم متوفر فقط للمشتركين. يرجى الترقية للوصول إلى هذه الميزة.
قم بالترقية الآنKeywords

هذا القسم متوفر فقط للمشتركين. يرجى الترقية للوصول إلى هذه الميزة.
قم بالترقية الآنHighlights

هذا القسم متوفر فقط للمشتركين. يرجى الترقية للوصول إلى هذه الميزة.
قم بالترقية الآنTranscripts

هذا القسم متوفر فقط للمشتركين. يرجى الترقية للوصول إلى هذه الميزة.
قم بالترقية الآنتصفح المزيد من مقاطع الفيديو ذات الصلة
BELAJAR UJI VALIDITAS DAN RELIABILITAS DATA PRIMER DENGAN SPSS (Bagian 1)

Cara Uji Validitas dan Reliabilitas dengan SPSS FULL
UJI VALIDITAS, RELIABILITAS, TINGKAT KESUKARAN DAN DAYA PEMBEDA SOAL TIPE URAIAN
5 MENIT PAHAM UJI VALIDITAS DAN RELIABILITAS ! SIAP DITANYA PENGUJI | #StudyWithTika

CARA MENGUJI VALIDITAS DAN RELIABILITAS SEBUAH DATA
validitas, reliabilitas, tingkat kesukaran dan daya pembeda menggunakan aplikasi SPSS 26.
5.0 / 5 (0 votes)
