Cara Membuat Peta DAS dan Menghitung Luas Catchment Area di ArcGis | Watershed Delineation on ArcGIS
Summary
TLDRThis tutorial video guides viewers through creating a basic map of a watershed, including river flow mapping and calculating area using GIS software. Starting with setting up coordinate systems and projecting DEM data, the instructor demonstrates step-by-step processes such as filling depressions, determining flow direction and accumulation, stream ordering, and defining watersheds. The video also covers converting raster data to vector format and calculating the area of each watershed in hectares. With clear instructions on data management, symbology, and visualization, this tutorial equips viewers to accurately analyze hydrological data and create detailed, customizable maps for various applications.
Takeaways
- 😀 Start by setting up your GIS software and adjusting the coordinate system to match your DEM data.
- 😀 Use the 'Fill' tool to preprocess the DEM and remove sinks for accurate hydrological analysis.
- 😀 Generate flow direction raster from the filled DEM to determine water movement paths.
- 😀 Create flow accumulation raster to identify potential stream networks based on water flow.
- 😀 Apply a conditional threshold to the flow accumulation raster to define significant streams.
- 😀 Use the 'Stream Order' tool to classify streams based on hierarchy and importance.
- 😀 Convert streams from raster to vector format using 'Stream to Feature' for easier visualization and analysis.
- 😀 Delineate watershed or catchment areas with the 'Basin' tool to identify contributing areas to each stream.
- 😀 Convert watershed rasters to vector polygons and calculate their area in hectares for further analysis.
- 😀 Customize symbology for streams and watersheds for clearer visualization and presentation.
- 😀 Organize your project outputs with clear naming and folder structures to streamline the workflow.
Q & A
What is the main objective of the tutorial in the video?
-The tutorial aims to demonstrate how to create a basic map of a watershed area, generate river networks, and calculate the area of a selected watershed using GIS tools.
What type of data is primarily used in this workflow?
-The workflow primarily uses DEM (Digital Elevation Model) raster data as the base for hydrological analysis.
Why is it important to set the coordinate system at the beginning?
-Setting the correct coordinate system ensures that all spatial data aligns properly and that measurements such as area and distance are accurate.
What is the purpose of the 'Fill' tool in hydrological analysis?
-The 'Fill' tool removes sinks or depressions in the DEM to ensure proper flow direction and accumulation modeling.
What does the 'Flow Direction' tool calculate?
-The 'Flow Direction' tool determines the direction water will flow from each cell in the DEM based on elevation.
What is the role of the 'Flow Accumulation' tool?
-The 'Flow Accumulation' tool calculates how much water accumulates in each cell, helping to identify potential stream channels.
Why is the 'Conditional' tool used after flow accumulation?
-The 'Conditional' tool is used to filter and classify cells based on flow accumulation values, typically to define where streams begin.
What is 'Stream Order' and why is it important?
-Stream Order classifies streams based on their hierarchy, helping to understand the structure and importance of different river segments.
What does the 'Stream to Feature' tool do?
-It converts raster stream data into vector format (lines), making it easier to visualize and analyze river networks.
What is the purpose of applying a 'Definition Query'?
-A Definition Query is used to filter and display only specific stream orders, improving visualization and focus on major streams.
How is a watershed (basin) area generated in the tutorial?
-A watershed area is generated using the 'Basin' tool, which delineates catchment areas based on flow direction data.
Why is raster data converted to vector (shapefile) format?
-Converting to vector format allows for easier editing, visualization, and calculation of attributes such as area.
How can a specific watershed area be isolated for analysis?
-A specific area can be selected and exported as a separate shapefile to isolate it from the rest of the dataset.
What tool is used to calculate the area of a watershed?
-The 'Calculate Geometry' tool is used to compute the area, typically in units such as hectares.
What is the final output of this workflow?
-The final output includes a mapped river network, delineated watershed areas, and calculated area values for selected basins.
Outlines

هذا القسم متوفر فقط للمشتركين. يرجى الترقية للوصول إلى هذه الميزة.
قم بالترقية الآنMindmap

هذا القسم متوفر فقط للمشتركين. يرجى الترقية للوصول إلى هذه الميزة.
قم بالترقية الآنKeywords

هذا القسم متوفر فقط للمشتركين. يرجى الترقية للوصول إلى هذه الميزة.
قم بالترقية الآنHighlights

هذا القسم متوفر فقط للمشتركين. يرجى الترقية للوصول إلى هذه الميزة.
قم بالترقية الآنTranscripts

هذا القسم متوفر فقط للمشتركين. يرجى الترقية للوصول إلى هذه الميزة.
قم بالترقية الآنتصفح المزيد من مقاطع الفيديو ذات الصلة
NRM 3300, F24, Lab 4 Create TX Contours

Hidrografia (2/5): direção de fluxo (flow direction) e definição de cursos d'água (streams) no QGis
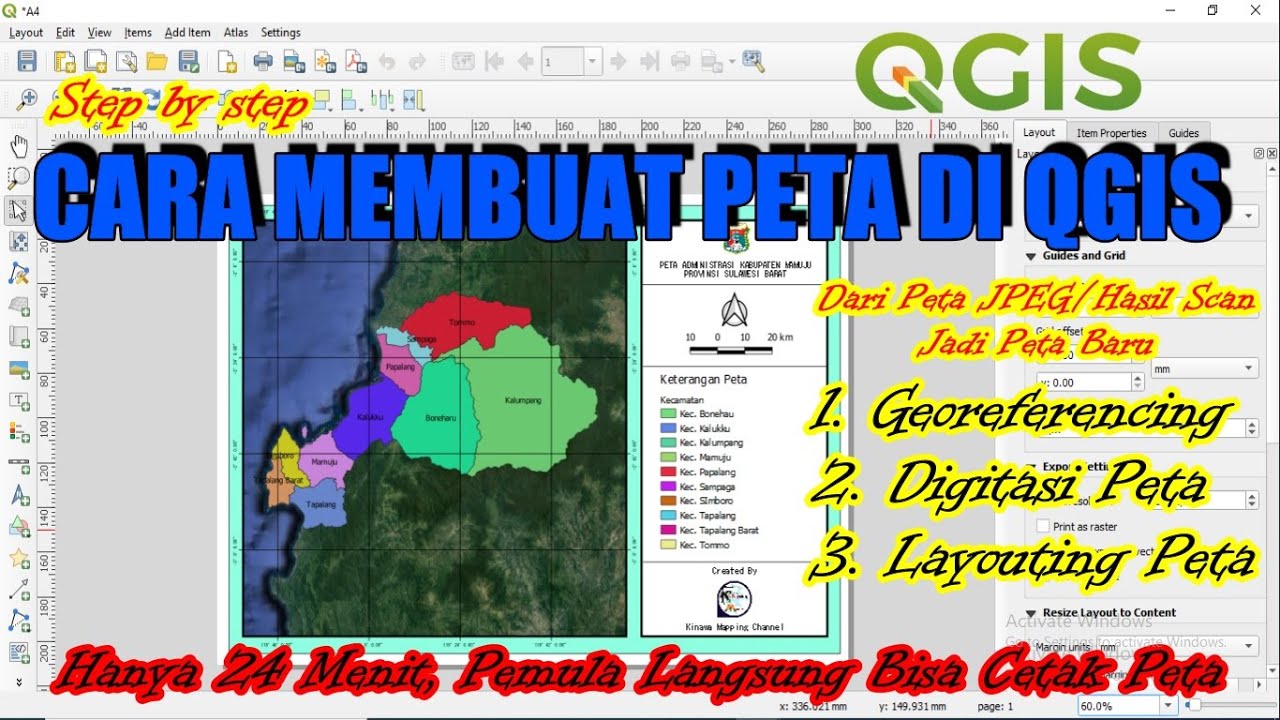
Cara Membuat Peta di QGis (Georeferencing, Digitasi, Layout)

Digitasi Peta Melalui Arcview 3.3
How to Prepare Slope Map from DEM #shorts #youtubeshorts #gis
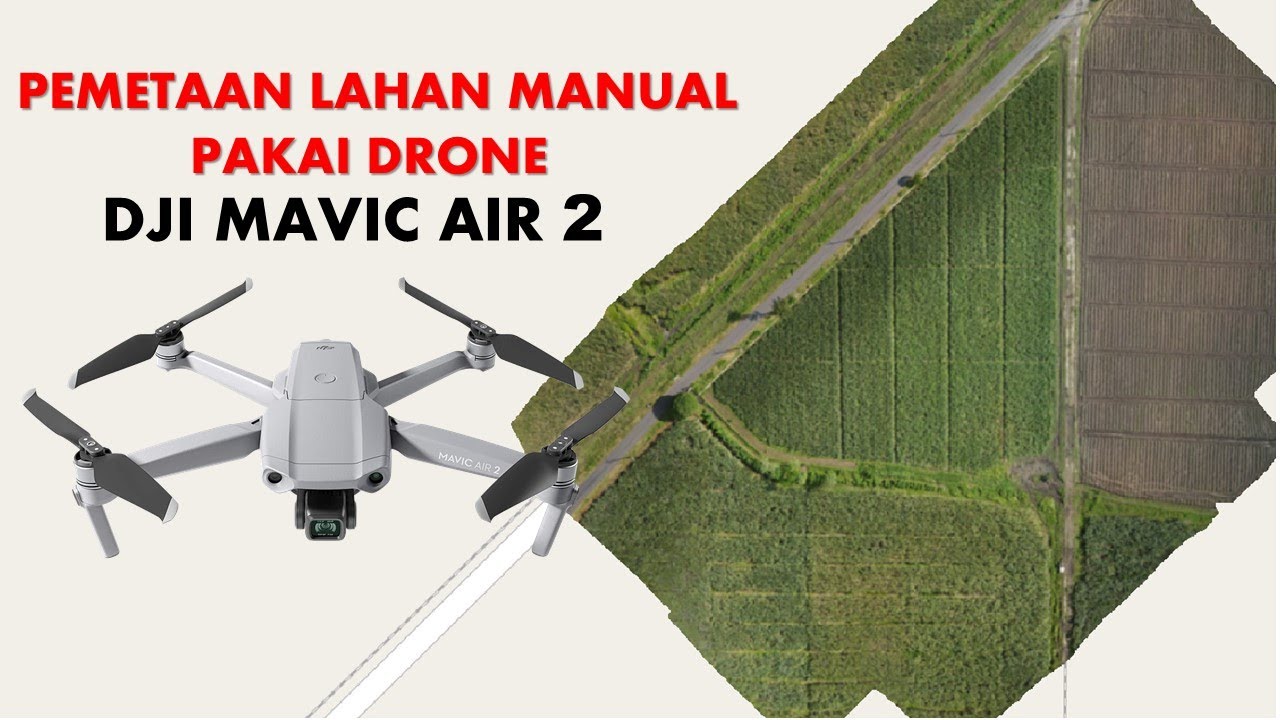
Cara Mapping Lahan dengan Drone MANUAL tanpa aplikasi MAPPING
5.0 / 5 (0 votes)
