SPSS Analisis Cluster Hierarchical Methods
Summary
TLDRThis tutorial demonstrates how to conduct a cluster analysis using SPSS on customer satisfaction data from a retail store. The store aims to improve its customer service by analyzing survey responses from 20 customers. The tutorial guides through the process of entering data into SPSS, defining variables, and performing hierarchical clustering. It also covers how to interpret the results, including identifying key satisfaction factors like service speed, product variety, and pricing. The analysis concludes that improvements in pricing and discount offerings are needed to enhance customer satisfaction.
Takeaways
- 😀 Cluster analysis in SPSS helps businesses segment customers based on their survey responses for improved decision-making.
- 😀 The case study focuses on a retail store aiming to enhance customer service through data analysis of customer satisfaction and demographics.
- 😀 Data for cluster analysis consists of customer demographics (e.g., gender, age, profession) and satisfaction levels (e.g., service speed, product availability, pricing).
- 😀 SPSS Data View and Variable View are essential for setting up variables and entering data, ensuring correct data types (nominal, ordinal, scale).
- 😀 To perform hierarchical cluster analysis in SPSS, select the appropriate variables, and use the agglomerative method and squared Euclidean distance for clustering.
- 😀 A dendrogram (tree diagram) is generated to visualize customer groups formed during the cluster analysis.
- 😀 After performing cluster analysis, a cluster membership table is created to assign each customer to a specific cluster (e.g., Cluster 1, Cluster 2).
- 😀 Descriptive statistics, including crosstabs and correlation analysis, are used to understand the profile of each cluster and identify patterns.
- 😀 Cluster 1 might have high satisfaction with service speed but lower satisfaction with pricing, while Cluster 2 might show the opposite.
- 😀 The insights gained from cluster analysis can guide retailers in improving specific areas, such as pricing, service speed, or discounts.
- 😀 SPSS cluster analysis helps businesses tailor marketing strategies and improve customer satisfaction by understanding the diverse needs of different customer groups.
Q & A
What is the purpose of the retail store’s survey in this case study?
-The retail store aims to improve its customer service by analyzing customer satisfaction through a survey. The data collected from the survey will help identify areas for improvement in their offerings.
What are the two types of questionnaires used in the case study?
-The two types of questionnaires are: one focused on customer demographics (gender, age, profession, spending, shopping frequency, loyalty duration) and the other on customer satisfaction (service speed, product availability, pricing, discounts, location, and parking).
How is the data for the survey collected and prepared for analysis?
-The data is first entered into an Excel spreadsheet, with each customer’s responses recorded. It is then imported into SPSS for analysis, where data is arranged into 'Variable View' and 'Data View'.
What are the two main views in SPSS for setting up data?
-In SPSS, there are two main views for setting up data: 'Variable View' (where you define the variables and their types) and 'Data View' (where you input the actual data).
What data types are used for the customer demographic variables in SPSS?
-The customer demographic variables are mostly set to 'Nominal' type, as they consist of categories like gender, age, and profession that don’t involve numerical measurements.
Which clustering method is used in the SPSS tutorial, and why is it chosen?
-The 'Hierarchical Clustering' method is used in the tutorial. It is chosen because it allows the creation of a dendrogram, a visual tool that helps identify natural groupings (clusters) of data based on similarity.
What is the purpose of the dendrogram in cluster analysis?
-The dendrogram is used to visually represent the hierarchical clustering process, showing how individual data points (customers) group together to form clusters based on their similarities.
How many clusters were identified in the case study, and what did they represent?
-Two clusters were identified. Cluster 1 consisted of satisfied customers, while Cluster 2 consisted of customers who were dissatisfied with pricing and discounts.
What was the key finding from the chi-square test conducted in the analysis?
-The chi-square test revealed that there were significant differences between the two clusters in terms of customer satisfaction, particularly regarding pricing and discounts. This indicated that improvements in those areas were needed.
What improvements did the tutorial suggest for the retail store based on the cluster analysis?
-The tutorial suggested that the retail store should focus on improving pricing and discount strategies, as Cluster 2 felt that the prices were too high and discounts were insufficient.
Outlines

هذا القسم متوفر فقط للمشتركين. يرجى الترقية للوصول إلى هذه الميزة.
قم بالترقية الآنMindmap

هذا القسم متوفر فقط للمشتركين. يرجى الترقية للوصول إلى هذه الميزة.
قم بالترقية الآنKeywords

هذا القسم متوفر فقط للمشتركين. يرجى الترقية للوصول إلى هذه الميزة.
قم بالترقية الآنHighlights

هذا القسم متوفر فقط للمشتركين. يرجى الترقية للوصول إلى هذه الميزة.
قم بالترقية الآنTranscripts

هذا القسم متوفر فقط للمشتركين. يرجى الترقية للوصول إلى هذه الميزة.
قم بالترقية الآنتصفح المزيد من مقاطع الفيديو ذات الصلة
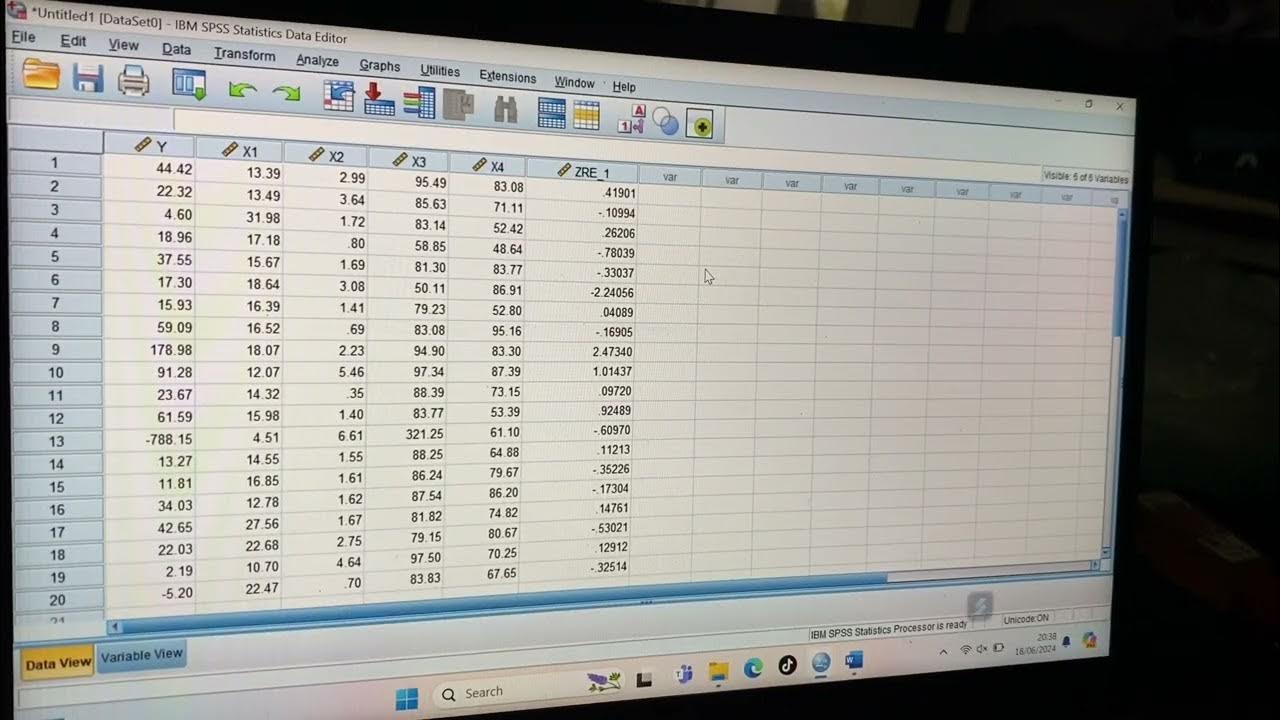
Dongeng tentang uji validitas Cara uji validitas spss 23, cara baca output
Tutorial Menggunakan Spss untuk data Panel

CARA MENGUJI VALIDITAS DAN RELIABILITAS SEBUAH DATA
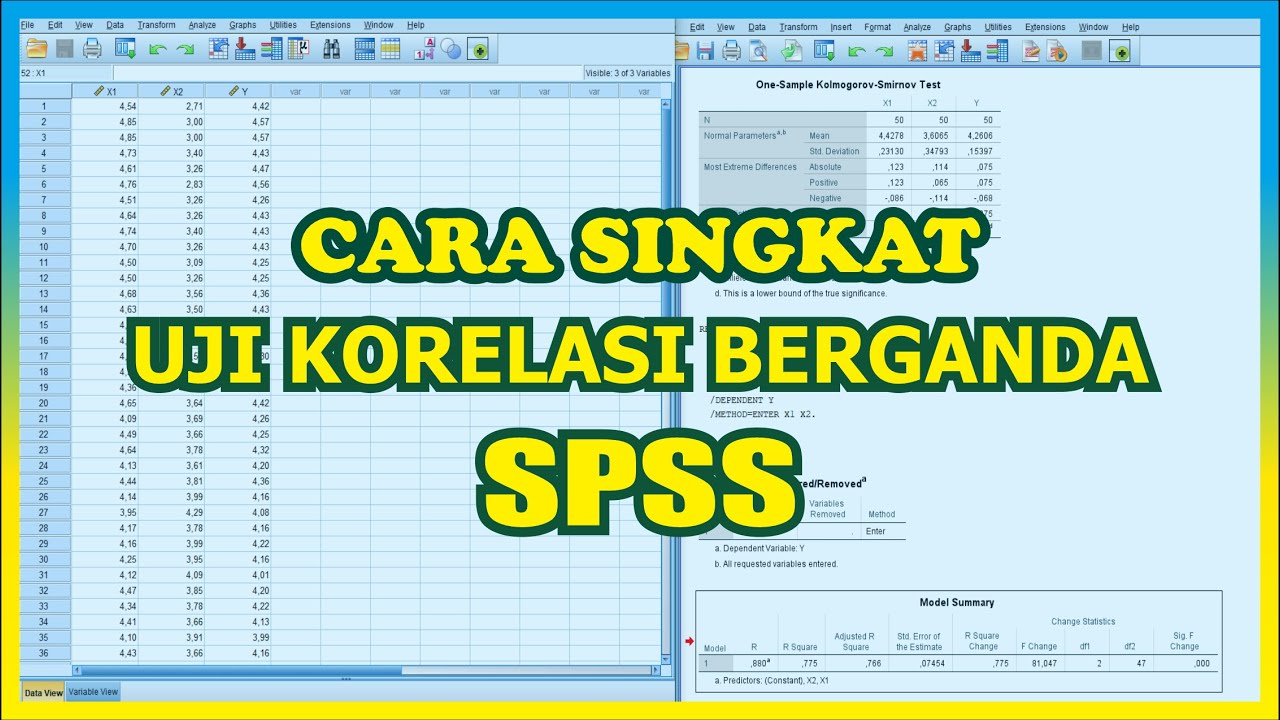
TUTORIAL SPSS : Multiple Correlation Test SPSS
Tutorial Analisis Korelasi Pearson dengan SPSS
Memahami Uji Korelasi Pearson dan Cara Analisis dengan SPSS
5.0 / 5 (0 votes)
