Cara menyusun tabel distribusi frekuensi, menentukan mean, median dan modus data kelompok
Summary
TLDRIn this educational video, the channel explains the process of creating frequency distribution tables and calculating key statistical values such as the mean, median, and mode for grouped data. The video walks viewers through each step, from sorting the data to calculating the range, class intervals, and frequencies. It then demonstrates how to compute the mean, median, and mode using specific formulas. The tutorial is thorough and provides clear examples, ensuring that even beginners can follow the steps easily. The video encourages engagement and aims to make the learning process both educational and enjoyable.
Takeaways
- 😀 The video introduces the concept of calculating the mean, median, and mode for grouped data, focusing on frequency distribution tables.
- 😀 The first step in solving the problem is to sort the data in increasing order for easier table construction, though it’s optional.
- 😀 To find the range, use the formula: Range (J) = X_max - X_min, where X_max is the largest number and X_min is the smallest number in the data set.
- 😀 To calculate the number of classes (k), use the formula: k = 1 + 3.3 * log(N), where N is the total number of data points (60 in this case).
- 😀 The class width (P) is determined by dividing the range by the number of classes: P = Range / k.
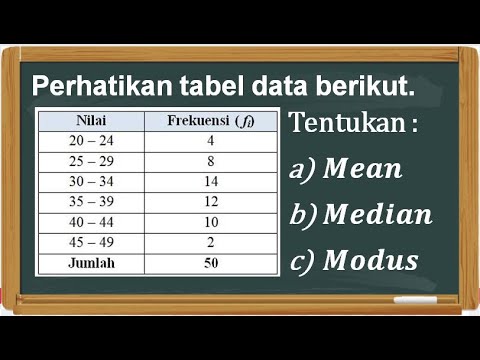
- 😀 A frequency distribution table is constructed by grouping data into intervals and counting the frequency of data points in each class.
- 😀 To calculate the mean, find the midpoint of each class, multiply by the frequency, sum the results, and divide by the total number of data points.
- 😀 The median is calculated by first finding the cumulative frequency (FK) and identifying the median class using the formula: M_e = T_B + (N/2 - FK) / F * P.
- 😀 The mode is found by identifying the class with the highest frequency and using the formula: M_o = T_B + (D1 / (D1 + D2)) * P, where D1 and D2 are the differences in frequency.
- 😀 The video emphasizes the importance of accuracy in calculations, ensuring the sum of frequencies matches the total number of data points.
- 😀 The tutorial concludes by reminding viewers to practice these steps to become proficient in calculating the mean, median, and mode for grouped data.
Q & A
What is the purpose of sorting the data before creating a frequency distribution table?
-Sorting the data helps in organizing it from the smallest to the largest number, making it easier to group data and identify the frequency distribution.
How is the range (J) of the data calculated in the frequency distribution process?
-The range (J) is calculated by subtracting the smallest number (X-) from the largest number (X Max) in the data. In this case, J = X Max - X- = 98 - 10 = 88.
What formula is used to calculate the number of classes (k) in a frequency distribution?
-The formula to calculate the number of classes (k) is k = 1 + 3.3 log N, where N is the total number of data points. For 60 data points, k = 1 + 3.3 log 60 ≈ 7.
What is the purpose of calculating the class width (P), and how is it determined?
-The class width (P) helps define the size of each interval in the frequency distribution. It is calculated by dividing the range (J) by the number of classes (k). For this example, P = J / k = 88 / 7 ≈ 12.57, which is rounded to 13.
Why is it important to round the class width (P) to a whole number?
-Rounding the class width (P) to a whole number ensures that each class interval is easy to work with and represents an actual data range without fractions.
How are the frequency counts determined for each class interval in the table?
-The frequency count for each class interval is determined by counting how many data points fall within the range of that class interval. For example, from 10 to 22, there are 3 data points.
How do you calculate the mean for grouped data, and what is the final formula used?
-To calculate the mean for grouped data, you multiply the frequency (Fi) by the midpoint (Xi) of each class, sum these products, and divide by the total frequency (ΣFi). The formula is X̄ = Σ (Fi * Xi) / Σ Fi.
What is the role of cumulative frequency (FK) in calculating the median?
-Cumulative frequency (FK) helps identify the class interval that contains the median. By calculating FK and comparing it to n/2, we can determine which class the middle value (median) falls into.
How do you calculate the median using the grouped data method, and what is the formula used?
-The median is calculated using the formula: Me = TB + (n/2 - FK) / F * P, where TB is the lower boundary of the median class, FK is the cumulative frequency before the median class, F is the frequency of the median class, and P is the class width.
How is the mode for grouped data determined, and which formula is used?
-The mode is determined by finding the class with the highest frequency. The formula used is Mo = TB + (D1 / (D1 + D2)) * P, where D1 is the difference between the frequency of the modal class and the frequency of the class before it, D2 is the difference between the frequency of the modal class and the frequency of the class after it, TB is the lower boundary of the modal class, and P is the class width.
Outlines

هذا القسم متوفر فقط للمشتركين. يرجى الترقية للوصول إلى هذه الميزة.
قم بالترقية الآنMindmap

هذا القسم متوفر فقط للمشتركين. يرجى الترقية للوصول إلى هذه الميزة.
قم بالترقية الآنKeywords

هذا القسم متوفر فقط للمشتركين. يرجى الترقية للوصول إلى هذه الميزة.
قم بالترقية الآنHighlights

هذا القسم متوفر فقط للمشتركين. يرجى الترقية للوصول إلى هذه الميزة.
قم بالترقية الآنTranscripts

هذا القسم متوفر فقط للمشتركين. يرجى الترقية للوصول إلى هذه الميزة.
قم بالترقية الآنتصفح المزيد من مقاطع الفيديو ذات الصلة

MAT 152 SAS 8 Video

STATISTIKA CARA MENCARI NILAI MEAN, MEDIAN, MODUS DATA KELOMPOK PART 1
Ukuran Pemusatan Data Kelompok

Statistika Dasar Ukuran Pemusatan Data (Mean, Modus, Median) Data Tunggal dan Data Kelompok
Menentukan Mean, Median, dan Modus Data Kelompok

Statistika : Cara mudah menentukan nilai Mean, median dan modus data kelompok
5.0 / 5 (0 votes)
