Cara Mudah membuat Distribusi Jawaban Responden dengan SPSS
Summary
TLDRIn this tutorial, the speaker demonstrates how to create a frequency distribution of survey responses using SPSS. Starting with preparing the questionnaire, gathering responses, and inputting data into SPSS, the video guides users through setting up variables, labeling responses, and defining a Likert scale for the answers. The speaker then shows how to generate and interpret the frequency distribution results, explaining how to assess the most common responses for each question. This step-by-step process is designed to help users analyze survey data effectively using SPSS.
Takeaways
- 😀 Begin by preparing a list of statements or questions for your questionnaire, which should relate to the variables you're analyzing (e.g., service quality).
- 😀 Ensure that the data from respondents is collected, such as through Google Forms, for ease of use in SPSS.
- 😀 In SPSS, set up the variable names in the 'Variable View' to match each question in your questionnaire.
- 😀 Make sure to set the decimal places to 0 for each variable in SPSS to avoid unnecessary precision.
- 😀 Copy and paste the question labels into SPSS from a document (e.g., Microsoft Word) to assign them to each variable.
- 😀 Define the response scale for your questions, ranging from 'Strongly Agree' (5) to 'Strongly Disagree' (1).
- 😀 To perform the frequency distribution, go to 'Analyze', select 'Descriptive Statistics', and then choose 'Frequencies'.
- 😀 Select all the variables corresponding to your questions and move them to the 'Variables' column in SPSS to generate a report.
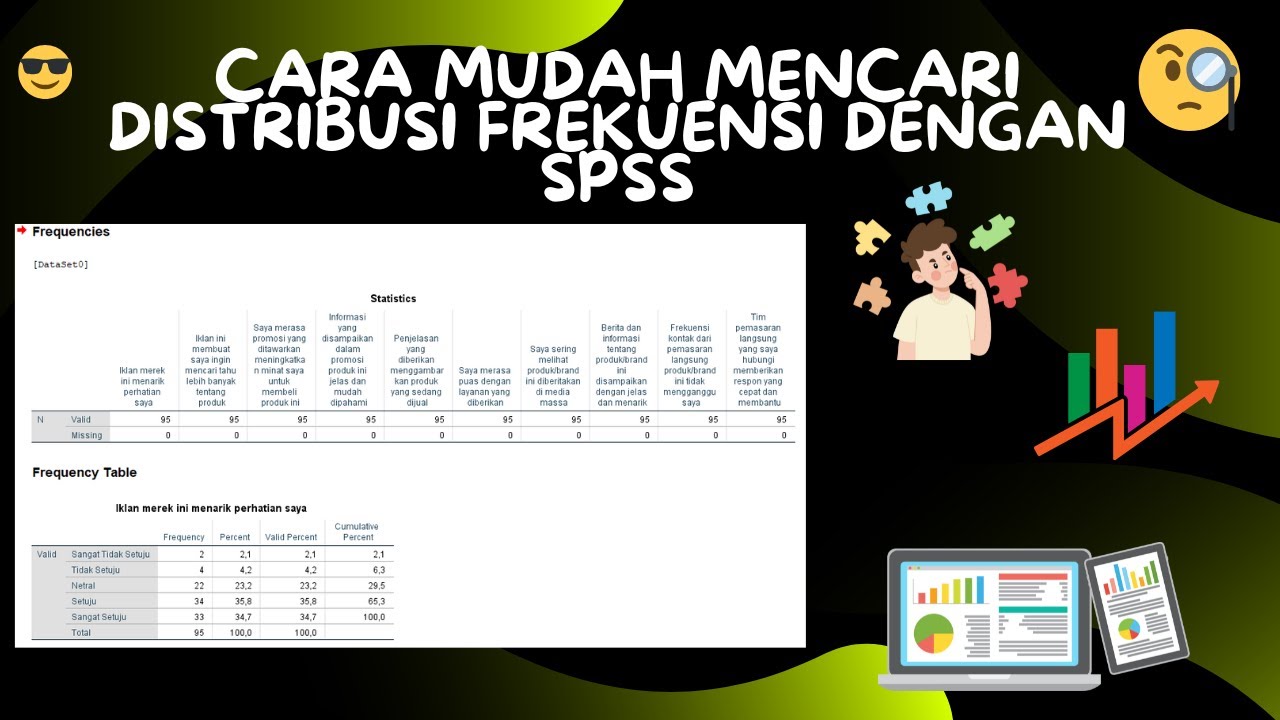
- 😀 The output will show the frequency distribution of each response, helping you understand how respondents answered each question.
- 😀 Review the distribution results to identify the most common answers (e.g., 'Strongly Agree' being the highest response).
- 😀 The process is simple and quick, allowing you to efficiently analyze respondent data using SPSS without much complexity.
Q & A
What is the main topic of the tutorial?
-The main topic of the tutorial is how to create a frequency distribution of survey responses using a questionnaire, specifically with the help of SPSS and Google Forms.
How many questions are included in the questionnaire used in the tutorial?
-The questionnaire used in the tutorial includes 10 questions related to the variable of 'service quality.'
What is the first step in creating the distribution of answers?
-The first step is to create a list of questions, which in this case are related to service quality, and ensure the data from respondents is available.
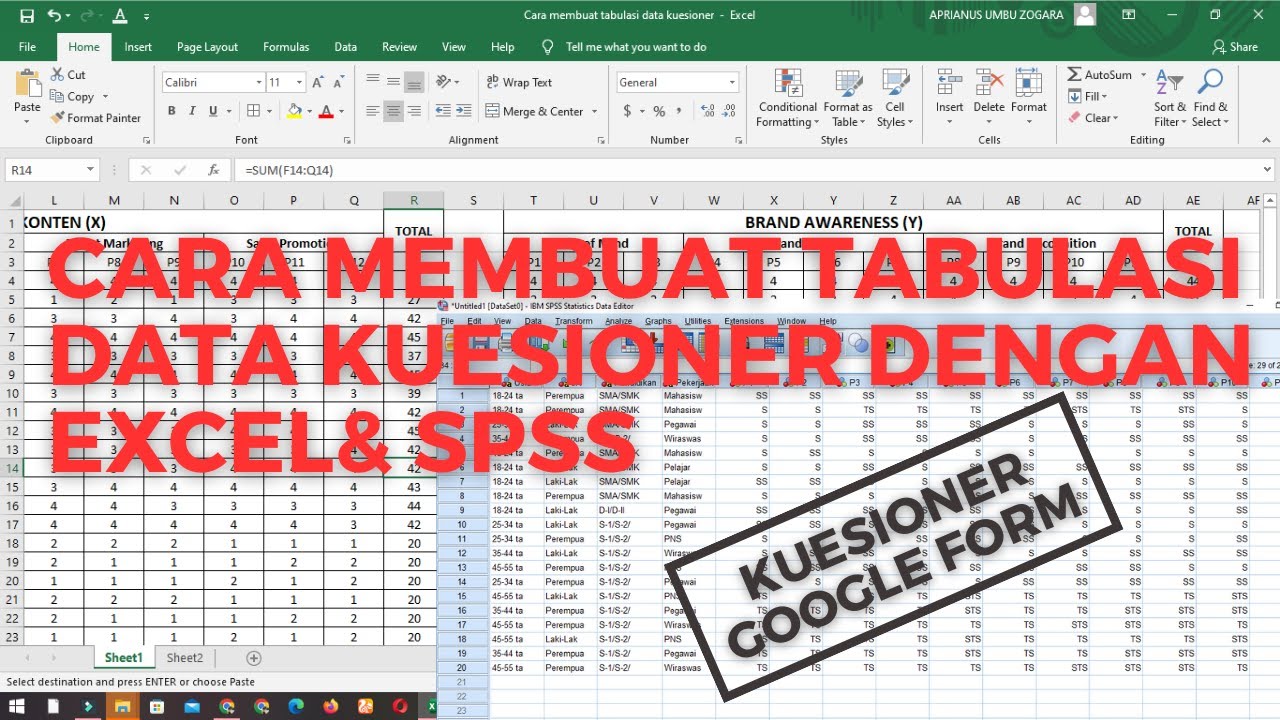
Where is the data for the respondents’ answers sourced from?
-The data for the respondents' answers is sourced from Google Forms.
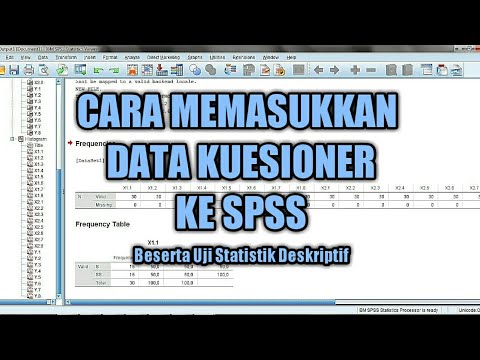
How are the respondents' answers transferred to SPSS?
-The answers are copied from the Google Forms and pasted into SPSS for further analysis.
What is done in the SPSS 'Variable View' section?
-In the 'Variable View' section of SPSS, the variables are named according to the 10 questions, and the decimal places are set to zero. Labels for the questions are also added.
How are the response scales labeled in the SPSS setup?
-The response scales are labeled as follows: 5 for 'Strongly Agree,' 4 for 'Agree,' 3 for 'Neutral,' 2 for 'Disagree,' and 1 for 'Strongly Disagree.'
What is the next step after setting up the variables and scales in SPSS?
-After setting up the variables and scales, the user proceeds to click on 'Analyze,' then 'Descriptive Statistics,' and finally 'Frequencies' to create the distribution of responses.
What does the output of the frequency distribution show?
-The output of the frequency distribution shows the number and percentage of respondents who selected each response for each question, allowing for an analysis of the distribution of answers.
What was the most common response for the first question in the survey?
-The most common response for the first question, which was about the appearance and interior of the Fulcaff Coffee building, was 'Strongly Agree,' with 37 respondents (30%).
Outlines

هذا القسم متوفر فقط للمشتركين. يرجى الترقية للوصول إلى هذه الميزة.
قم بالترقية الآنMindmap

هذا القسم متوفر فقط للمشتركين. يرجى الترقية للوصول إلى هذه الميزة.
قم بالترقية الآنKeywords

هذا القسم متوفر فقط للمشتركين. يرجى الترقية للوصول إلى هذه الميزة.
قم بالترقية الآنHighlights

هذا القسم متوفر فقط للمشتركين. يرجى الترقية للوصول إلى هذه الميزة.
قم بالترقية الآنTranscripts

هذا القسم متوفر فقط للمشتركين. يرجى الترقية للوصول إلى هذه الميزة.
قم بالترقية الآنتصفح المزيد من مقاطع الفيديو ذات الصلة


5.0 / 5 (0 votes)
