Olympic Data Analytics | Azure End-To-End Data Engineering Project | Part 2
Summary
TLDRThis tutorial walks viewers through using Azure Synapse Analytics for data engineering, focusing on data ingestion, analysis, and SQL queries to explore Olympic data. It covers uploading CSV files, creating tables for athletes, medals, and teams, and running SQL queries to analyze athlete participation and medal statistics. Though the project doesn't include dashboard creation, viewers are encouraged to build their own visualizations using Power BI or Tableau. The tutorial provides a solid foundation in data engineering, while encouraging further exploration with additional features like triggers and scheduled analytics.
Takeaways
- 😀 The project focuses on using Azure Synapse Analytics for data engineering tasks.
- 😀 Data ingestion and transformation are key parts of the process in Azure Synapse.
- 😀 The tutorial guides users through setting up a Synapse Analytics workspace and loading data from a storage location.
- 😀 SQL queries are used to analyze datasets, such as calculating the number of athletes and the total medals won by each country.
- 😀 Tables for various datasets (athletes, coaches, entries, medals) are created within the database.
- 😀 The project emphasizes the engineering side of data management rather than dashboarding or visualizations.
- 😀 Users are encouraged to build their own dashboard using Power BI or Synapse Analytics after completing the data analysis.
- 😀 The tutorial suggests exporting the data or using a visualization tool to create a dashboard from the data.
- 😀 The scope of the project focuses solely on data engineering tasks like loading, transforming, and analyzing data.
- 😀 The instructor encourages users to tag them on social media once the project is completed, sharing their work for networking and visibility.
Q & A
What is the main focus of the video in terms of Azure services?
-The video focuses on an end-to-end data engineering project using Azure Synapse Analytics, including data ingestion, transformation, and basic SQL analysis.
Why does the speaker suggest watching part one of the video first?
-The speaker recommends watching part one first to understand the foundational concepts of the project before diving into the detailed steps in part two.
What is the purpose of creating a Synapse Analytics workspace in the Azure portal?
-The purpose of creating a Synapse Analytics workspace is to manage resources like databases, data pipelines, and metadata storage, which are essential for performing analytics tasks.
How does the speaker suggest handling storage while creating the Synapse workspace?
-The speaker suggests selecting an existing storage account, such as the 'Tokyo Olympic' storage account, during the creation process. If no storage account exists, a new one can be created.
What role does the 'Develop' section in Synapse Analytics play?
-The 'Develop' section in Synapse Analytics allows users to create and manage SQL scripts, Spark code, and pipelines. It provides a platform to write queries, develop notebooks, and handle data flows.
How does Synapse Analytics compare with other Azure services like Data Factory and Databricks?
-Synapse Analytics can perform tasks that are traditionally done by Azure Data Factory or Databricks. It integrates data pipeline creation, Spark code, and SQL analysis, offering an all-in-one solution within a single workspace.
What steps are involved in creating and loading a database within Synapse Analytics?
-To create and load a database, the speaker demonstrates selecting 'Lake Data' as the source, creating a new database, and loading tables from files stored in the data lake. The tables are created by linking the files and specifying necessary configurations like the first row as column headers.
What is the purpose of SQL queries in this project, and how are they used for analysis?
-SQL queries are used to analyze the data by performing operations like counting athletes from each country and calculating the total number of medals won by each country. The speaker also shows how to calculate averages based on gender and discipline.
What kind of basic analytics does the speaker perform on the Tokyo Olympic data?
-The speaker performs basic SQL analytics such as counting athletes by country, calculating the total number of medals by country (gold, silver, bronze), and analyzing entries based on gender and discipline.
What is the next step after loading data into Synapse Analytics, according to the speaker?
-The next step, after loading the data, is to create visualizations or dashboards. While the speaker doesn't demonstrate dashboard creation due to platform limitations, they suggest connecting Synapse Analytics to Power BI or Tableau for data visualization.
Outlines

هذا القسم متوفر فقط للمشتركين. يرجى الترقية للوصول إلى هذه الميزة.
قم بالترقية الآنMindmap

هذا القسم متوفر فقط للمشتركين. يرجى الترقية للوصول إلى هذه الميزة.
قم بالترقية الآنKeywords

هذا القسم متوفر فقط للمشتركين. يرجى الترقية للوصول إلى هذه الميزة.
قم بالترقية الآنHighlights

هذا القسم متوفر فقط للمشتركين. يرجى الترقية للوصول إلى هذه الميزة.
قم بالترقية الآنTranscripts

هذا القسم متوفر فقط للمشتركين. يرجى الترقية للوصول إلى هذه الميزة.
قم بالترقية الآنتصفح المزيد من مقاطع الفيديو ذات الصلة
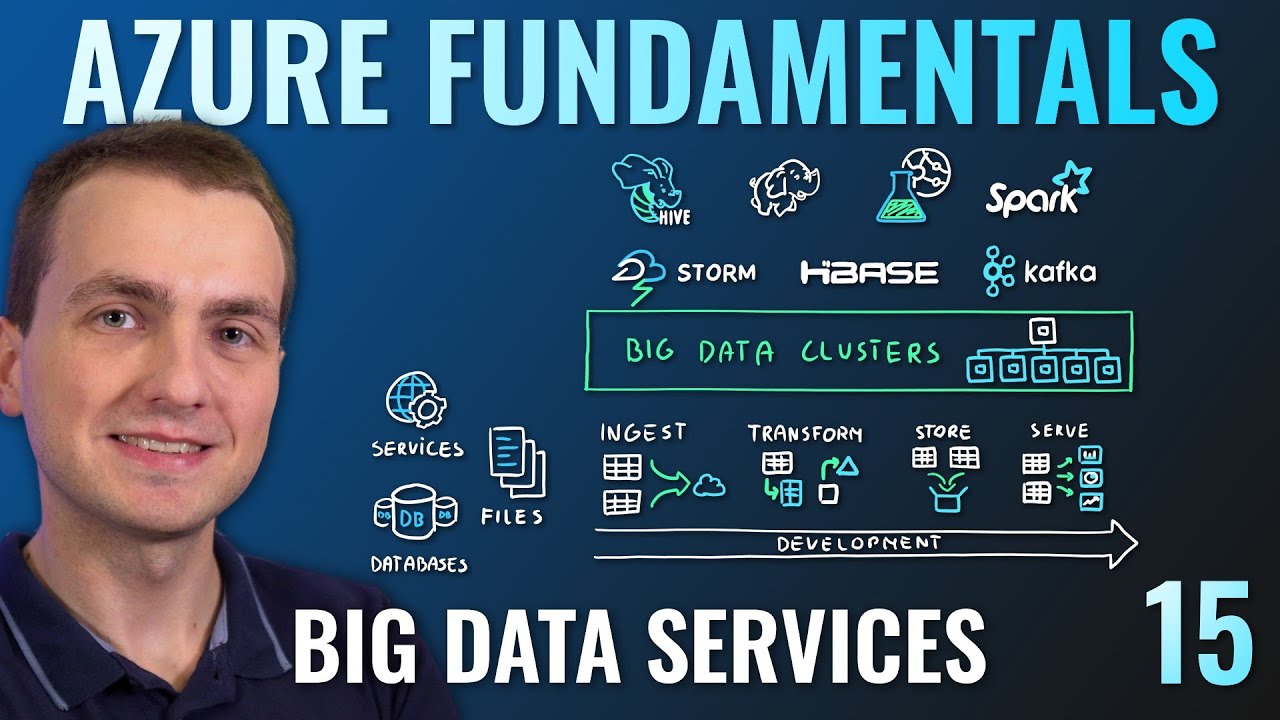
AZ-900 Episode 15 | Azure Big Data & Analytics Services | Synapse, HDInsight, Databricks
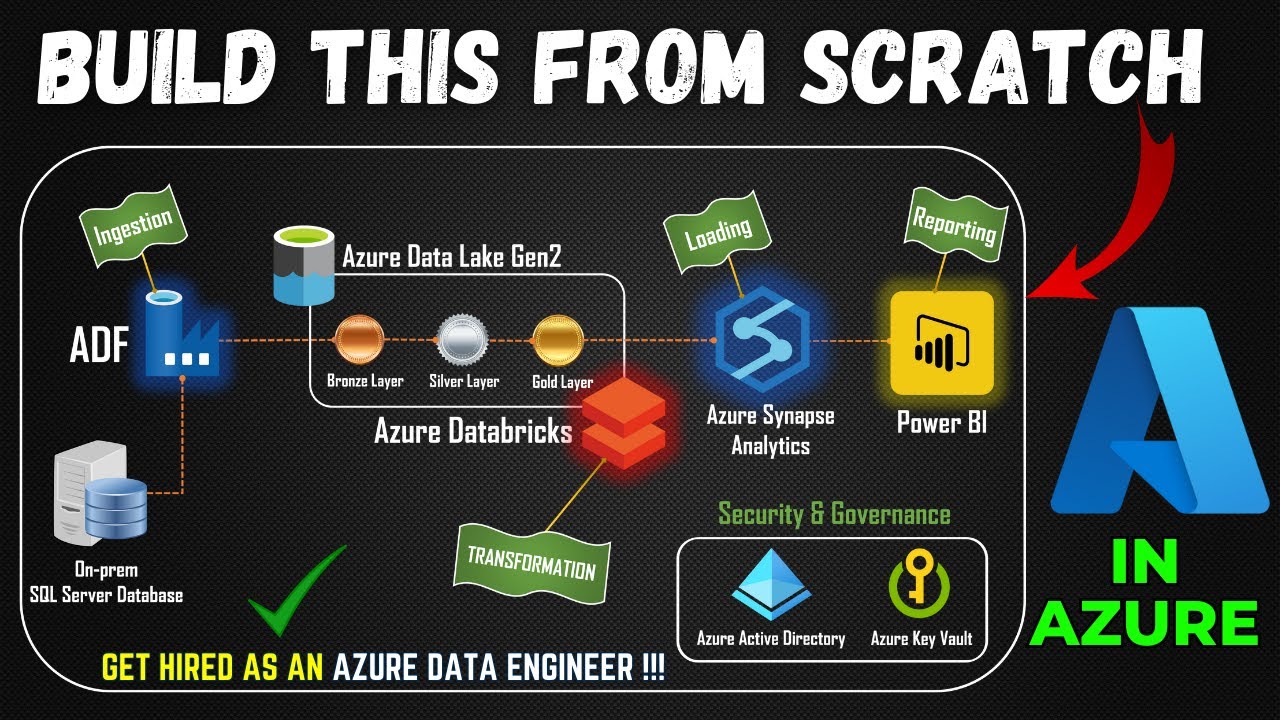
Part 1- End to End Azure Data Engineering Project | Project Overview
Requirements, admin portal, gateways in Microsoft Fabric | DP-600 EXAM PREP (2 of 12)

Projeto em SQL - Como analisar vendas de notebooks usando SQL

🚀 Introduction to Microsoft Fabric | Microsoft Fabric Playlist

What is BigQuery?
5.0 / 5 (0 votes)
