(Part 1) FUNGSI KOMPOSISI DAN FUNGSI INVERS MATEMATIKA SMA KELAS 11 #kurikulummerdeka #matematikasma
Summary
TLDRThis video lesson covers high school mathematics for Grade 11, focusing on function composition and inverse functions, aligned with the Merdeka Curriculum. Using real-world examples like fuel purchases, it explains how functions relate inputs (like fuel volume) to outputs (costs). The lesson also introduces linear functions and explores relationships between variables such as fuel consumption and vehicle distance. It delves into core concepts like domain, codomain, range, and inverse functions, with visual representations such as arrow diagrams and Cartesian graphs to help students understand functions versus non-functions. The lesson wraps up with a preview of upcoming exercises and discussions.
Takeaways
- 📚 The video introduces the topic of function composition and inverse functions for 11th-grade high school math in the Merdeka curriculum.
- ⛽ A relatable example is used where fuel costs are related to the volume of fuel purchased, showing a linear function relationship.
- 📈 The relationship between fuel volume and cost is represented by the equation B = 10,000V, where B is the cost and V is the volume of fuel.
- 🚗 The video discusses the relationship between fuel consumption and distance traveled, introducing the concept of domain, codomain, and range in functions.
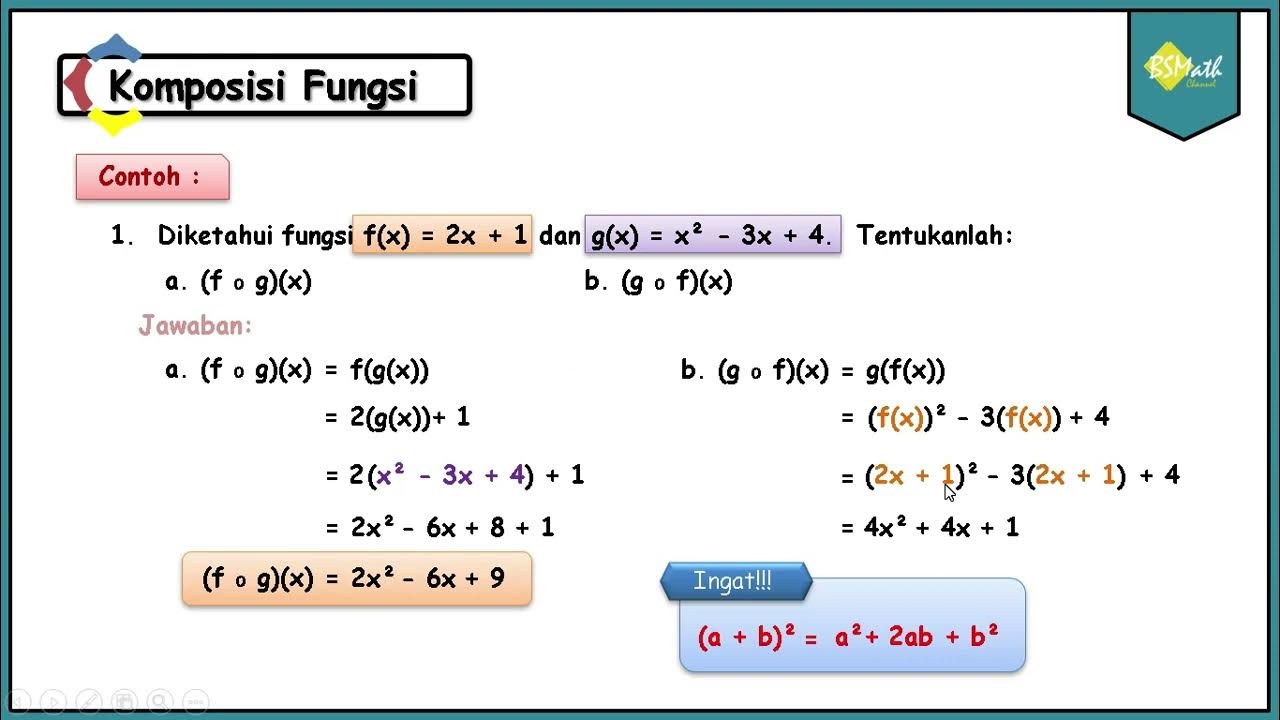
- 🔄 Function composition and operations are introduced, focusing on how functions interact and are combined in practical scenarios.
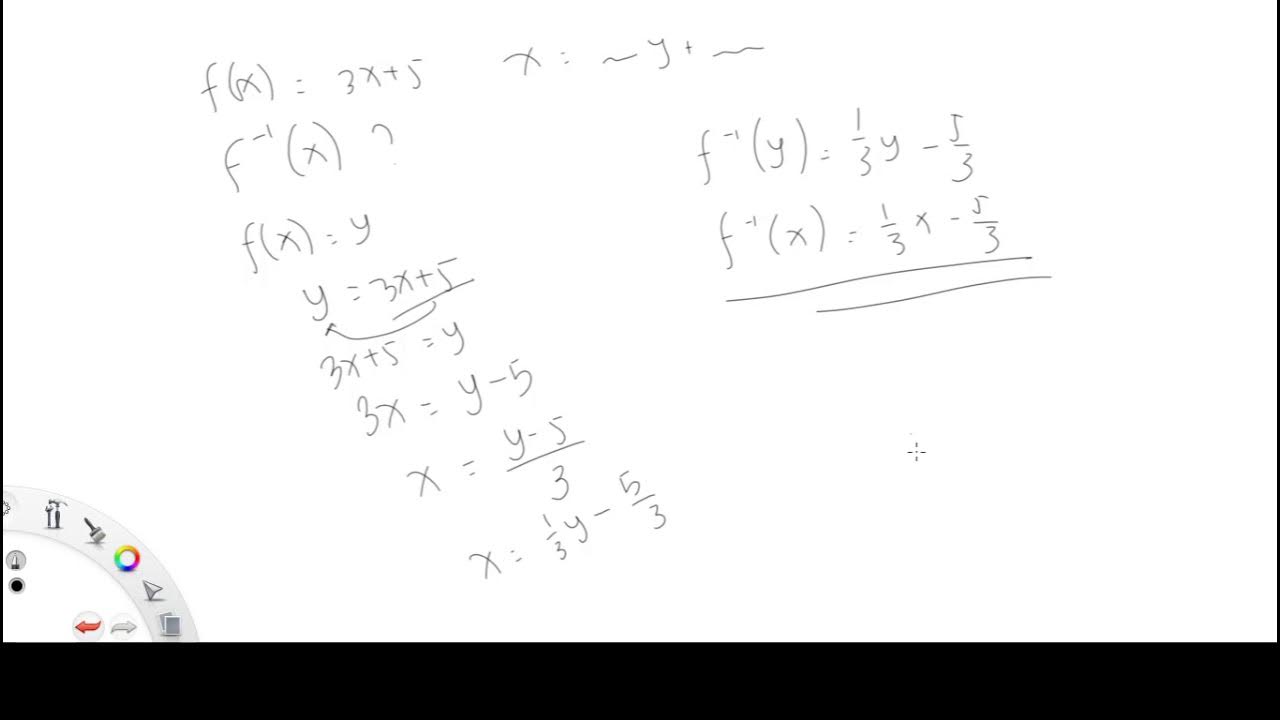
- 🔍 Inverse functions are explained by reversing the process, such as determining fuel volume based on a given cost, with a focus on understanding inverse relationships.
- ⚽ A relatable example involving Cristiano Ronaldo is used to introduce the concept of relations, explaining how players are assigned specific jersey numbers.
- 🔗 The difference between relations and functions is explained using arrow diagrams, highlighting how functions have one-to-one input-output relationships.
- ✅ The video emphasizes how to identify whether a relation is a function by checking if each input has a single output, using diagrams and Cartesian plots.
- 📊 The video introduces the vertical line test to check whether a graph represents a function, showing examples of both functions and non-functions.
Q & A
What is the main topic of the video?
-The main topic of the video is 'Function Composition and Inverse Functions,' which is part of the 11th-grade mathematics curriculum in Indonesia under the Merdeka Belajar framework.
What example is used to explain the concept of functions in the video?
-The example used is the relationship between the volume of fuel purchased at a gas station and the cost. The video explains how the cost is a function of the volume of fuel, where the cost is directly proportional to the volume.
How is the relationship between the volume of fuel and cost expressed in the video?
-The relationship is expressed using the equation B = 10,000 * V, where B represents the cost in rupiahs and V represents the volume of fuel in liters. This is an example of a linear function.
What is the difference between a function and a relation?
-A function is a special type of relation where each element from the input set (domain) is associated with exactly one element from the output set (codomain). In contrast, a general relation may associate one input with multiple outputs.
What is the significance of domain, codomain, and range in a function?
-The domain is the set of all possible inputs, the codomain is the set of potential outputs, and the range is the actual set of outputs that correspond to the inputs. These concepts are important for understanding the behavior and limitations of a function.
How does the video explain inverse functions?
-The video explains inverse functions by reversing the roles of input and output. For example, if the cost is known, the inverse function can determine how much fuel can be purchased. In this case, the equation B = 10,000 * V is rearranged to solve for V, making V the subject.
What analogy is used to explain the concept of a function?
-The analogy of a machine is used to explain functions, where an input (X) is processed through a machine (the function) to produce an output (Y).
How is the concept of relations visualized in the video?
-Relations are visualized using arrow diagrams and Cartesian diagrams. Arrow diagrams show the pairing of elements between two sets, and Cartesian diagrams plot these pairs on a graph with input values on the x-axis and output values on the y-axis.
What is a vertical line test, and how is it used to determine if a relation is a function?
-The vertical line test involves drawing vertical lines on the graph of a relation. If any vertical line crosses the graph at more than one point, the relation is not a function. If it crosses at only one point, it is a function.
What is an example of a non-function relation provided in the video?
-An example of a non-function is given where an input value is paired with two different outputs. For instance, if Q is paired with both Y and Z in a diagram, it violates the rule that each input must be paired with exactly one output.
Outlines

هذا القسم متوفر فقط للمشتركين. يرجى الترقية للوصول إلى هذه الميزة.
قم بالترقية الآنMindmap

هذا القسم متوفر فقط للمشتركين. يرجى الترقية للوصول إلى هذه الميزة.
قم بالترقية الآنKeywords

هذا القسم متوفر فقط للمشتركين. يرجى الترقية للوصول إلى هذه الميزة.
قم بالترقية الآنHighlights

هذا القسم متوفر فقط للمشتركين. يرجى الترقية للوصول إلى هذه الميزة.
قم بالترقية الآنTranscripts

هذا القسم متوفر فقط للمشتركين. يرجى الترقية للوصول إلى هذه الميزة.
قم بالترقية الآنتصفح المزيد من مقاطع الفيديو ذات الصلة

Komposisi Fungsi - Matematika Wajib Kelas XI Kurikulum Merdeka

FUNCTIONS | SHS GRADE 11 GENERAL MATHEMATICS QUARTER 1 MODULE 1 LESSON 1

Komposisi Fungsi Part 3 - Fungsi invers dan Sifat-sifatnya [ Matematika Wajib Kelas X ]

Matematika Teknik 4. Fungsi

Daerah Asal Alami Fungsi Rasional dan Fungsi Irasional - Matematika SMA Kelas XI Kurikulum Merdeka

Fungsi Invers Eksplorasi 1.8 Hal 38-39 Bab 1 FUNGSI INVERS Kelas 11 SMA Kurikulum Merdeka
5.0 / 5 (0 votes)
