FUNCTIONS | SHS GRADE 11 GENERAL MATHEMATICS QUARTER 1 MODULE 1 LESSON 1

Rowena Olofernes
15 Sept 202023:14

Summary

TLDRThis video script introduces a high school general mathematics lesson for grade 11, focusing on real-life functions. It sets three objectives: understanding functions and relations, illustrating functions through mapping diagrams, sets, and graphs, and representing real-life situations with functions. The lesson uses a crossword puzzle to review key terms and emphasizes that a function is a special kind of relation where each input value is associated with exactly one output value. Examples of mapping, sets, and the vertical line test in graphing are provided to identify functions. The script concludes with real-life function examples and a 10-item assessment to reinforce learning.

Takeaways

  • πŸ“ The lesson is designed for 11th-grade general mathematics, focusing on real-life functions.
  • πŸ“š Students are encouraged to prepare a paper and pen to write down their answers and solutions to problems presented in the video.
  • πŸ” The importance of pausing and revisiting the video for mastery is emphasized, allowing for a flexible learning pace.
  • 🎯 The lesson has three main objectives: to determine functions and relations, illustrate functions through mapping diagrams, sets, and graphs, and represent real-life situations using functions.
  • πŸ”‘ A crossword puzzle is used to recall essential terms from junior high school mathematics, which are crucial for understanding the new material.
  • πŸ” The definition of a function is highlighted as a special kind of relation where every element in the domain is paired with exactly one element in the range.
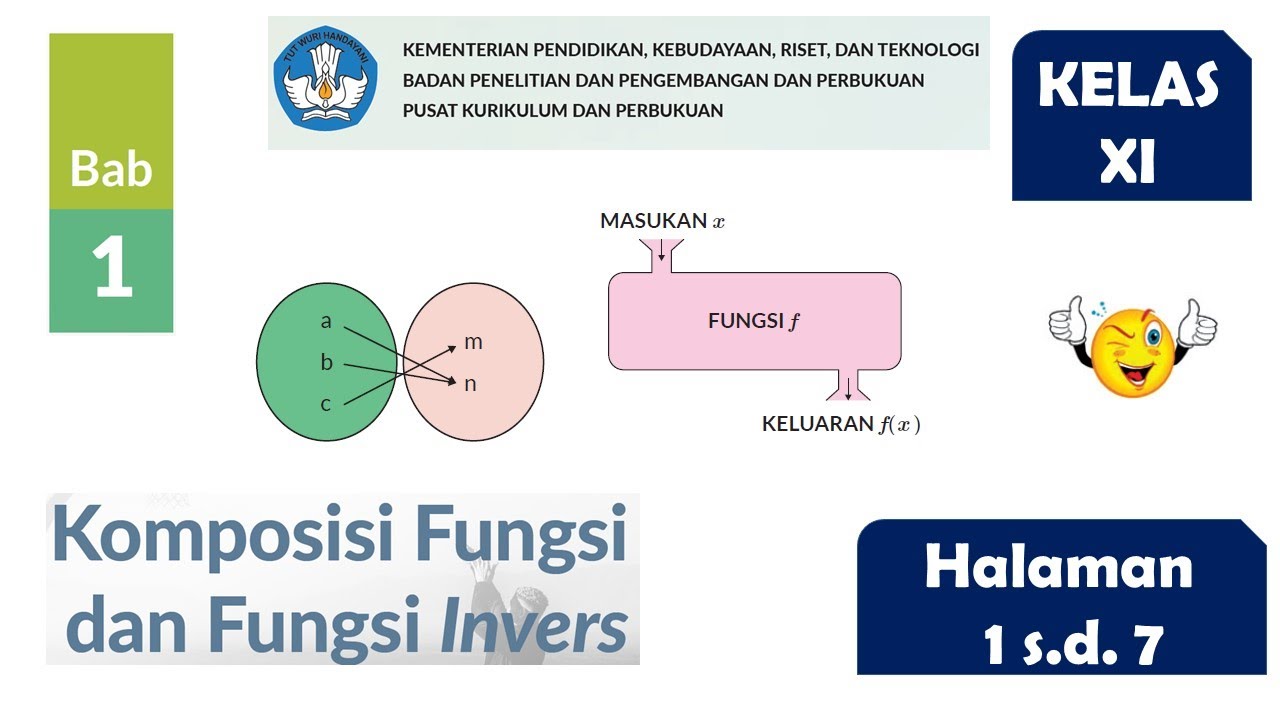
  • πŸ“ˆ Mapping diagrams are introduced as a tool to visually represent how elements of a function are paired, aiding in understanding the concept of functions.
  • πŸ“Š The concept of the domain and range in functions is explained, with examples provided to illustrate how to identify them within sets of ordered pairs.
  • βœ… The vertical line test (VLT) is introduced as a method to determine if a graph represents a function, where only one point of intersection with any vertical line is allowed.
  • 🌐 Real-life examples of functions are given, such as the relationship between the circumference of a circle and its diameter, the length of a shadow and a person's height, and the location of a car as a function of time.
  • πŸ“ A 10-item assessment is provided at the end of the lesson to check students' understanding of the material covered.

Q & A

  • What are the three main objectives of the lesson on real life functions?

    -The three main objectives are to determine functions and relations, illustrate functions through mapping diagrams, sets, and graphs, and represent real life situations using functions.

  • What is the definition of a 'relation' in the context of this lesson?

    -A relation is a rule that relates values from a set of values, known as the domain, to a second set of values, known as the range.

  • What is an 'ordered pair' and how is it represented?

    -An ordered pair is a sequence of two elements, typically enclosed in parentheses and separated by a comma, representing a specific order of elements.

  • What is the 'domain' of a function and how is it determined?

    -The domain of a function is the set of all input values or the first elements of the ordered pairs in the set of ordered pairs representing the function.

  • What is the 'range' of a function and how is it determined?

    -The range of a function is the set of all output values or the second elements of the ordered pairs in the set of ordered pairs representing the function.

  • What is a 'function' in mathematical terms and what is its defining rule?

    -A function is a special kind of relation where every element in the domain is associated with exactly one element in the range, meaning each x value is paired with only one y value.

  • How can you determine if a given set of ordered pairs represents a function using the mapping diagram?

    -In a mapping diagram, check if every element in the domain is associated with only one value in the range. If so, the set represents a function.

  • What is the 'Vertical Line Test' (VLT) and how is it used to determine if a graph represents a function?

    -The Vertical Line Test (VLT) is a method used in graphing to determine if a graph represents a function by checking if any vertical line would touch the graph at more than one point. If it does, the graph does not represent a function.

  • What is the circumference of a circle as a function of its diameter and how is it represented mathematically?

    -The circumference of a circle is a function of its diameter and can be represented as \( C = \pi D \) or as a function of its radius as \( C = 2\pi r \).

  • Can you provide an example of a real-life function from the script?

    -One example from the script is the length of a person's shadow on the floor, which is a function of their height.

  • What is the significance of the Vertical Line Test in identifying functions from graphs?

    -The significance of the Vertical Line Test is that it provides a visual and straightforward method to determine if a graph represents a function by ensuring that no vertical line intersects the graph more than once.

Outlines

00:00

πŸ“š Introduction to General Mathematics for Grade 11

This paragraph introduces a video lesson aimed at Grade 11 students studying general mathematics. The focus is on real-life functions, and the students are encouraged to prepare a pen and paper for note-taking. The instructor suggests pausing the video for reflection and review. The lesson's objectives include understanding functions and relations, illustrating functions through various methods, and representing real-life situations with functions. A crossword puzzle is presented as a warm-up activity to recall key terms from junior high school mathematics.

05:02

πŸ” Understanding Functions and Relations

The paragraph delves into the concept of functions as a special type of relation where each input (x-value) is linked to a single output (y-value). The importance of this one-to-one correspondence is emphasized as the defining characteristic of a function. The instructor uses mapping diagrams to visually demonstrate how elements of the domain are paired with elements in the range, and provides examples to illustrate whether a given set of ordered pairs represents a function based on this rule.

10:04

πŸ“ Function Identification through Mapping and Sets

This section uses mapping diagrams and set notation to further explore the identification of functions. The use of rooster notation to list ordered pairs and the importance of distinct x-values in determining whether a set is a function are discussed. The paragraph provides examples that allow students to practice identifying functions by checking for repeated x-values, which would disqualify a set from being a function.

15:06

πŸ“ˆ Graphing Functions and the Vertical Line Test

The paragraph introduces the concept of graphing functions and the use of the vertical line test (VLT) to determine if a graph represents a function. The VLT involves drawing imaginary vertical lines across a graph to see if they intersect the graph more than once. If they do, the graph does not represent a function. Several examples of graphs are given for students to practice applying the VLT and identify which are functions and which are not.

20:07

πŸš— Real-Life Applications and Assessment of Functions

The final paragraph connects the concept of functions to real-life scenarios, such as the relationship between the circumference of a circle and its diameter, the length of a shadow relative to a person's height, and the location of a car as a function of time. An assessment with 10 items is presented for students to test their understanding of the lesson. The instructor reminds students to remember the definition of a function, the methods of illustration, and the prevalence of functions in everyday life.

Mindmap

Keywords

πŸ’‘Function

A function in mathematics is a relation where each element of the domain is associated with exactly one element in the range. It is a central concept in the video, as it is the main theme discussed throughout. For example, the video explains that the circumference of a circle is a function of its diameter, where for every diameter, there is a unique circumference.

πŸ’‘Domain

The domain refers to the set of all possible input values for a function. In the context of the video, the domain is illustrated as the first element in each ordered pair, serving as the input values that are mapped to outputs.

πŸ’‘Range

The range is the set of all possible output values of a function, which are the second elements in the ordered pairs after the domain elements have been mapped. The video clarifies that the range is the set of y-values in a function, ensuring that each x-value in the domain corresponds to a single y-value in the range.

πŸ’‘Relation

A relation is a set of ordered pairs, where an element from one set is associated with an element from another set. The video uses the term to distinguish between general relations and functions, emphasizing that a function is a special kind of relation with the unique correspondence of each x-value to a single y-value.

πŸ’‘Ordered Pair

An ordered pair is a sequence of two elements, typically denoted by a pair of numbers enclosed in parentheses and separated by a comma, such as (1, 2). The video explains that ordered pairs are used to represent the input-output relationship in functions, with the first number representing the domain element and the second representing the range element.

πŸ’‘Mapping Diagram

A mapping diagram is a visual representation used to illustrate the relationship between the domain and range in a function. The video uses mapping diagrams to show how each element in the domain is paired with a unique element in the range, helping to identify whether a given set of ordered pairs represents a function.

πŸ’‘Set

In mathematics, a set is a collection of distinct objects, considered as an object in its own right. The video discusses sets in the context of identifying functions, ensuring that no x-value is repeated in the set of ordered pairs, which would indicate a function.

πŸ’‘Vertical Line Test (VLT)

The vertical line test is a graphical method to determine if a curve is a function. If any vertical line intersects the curve at more than one point, the curve does not represent a function. The video demonstrates the use of the vertical line test with various graphs to identify which are functions and which are not.

πŸ’‘Circumference

The circumference of a circle is the measure of the distance around the circle. In the video, it is used as a real-life example of a function, where the circumference is directly proportional to the diameter or radius, illustrating the concept of a function in a practical context.

πŸ’‘Shadow

The length of a shadow cast by an object is used in the video as an example of a real-life function. The shadow's length is a function of the object's height and the angle of the light source, demonstrating how functions can be observed in everyday situations.

πŸ’‘Graph

In the context of the video, a graph is a visual representation of a function or set of data points on a coordinate plane. The video explains how to determine if a graph represents a function by using the vertical line test, with examples of graphs that pass and fail this test.

Highlights

Introduction to the lesson on real life functions for grade 11 general mathematics.

Instructions to prepare a paper and pen for note-taking and problem-solving.

Advice on using video features like pause and replay for mastery of the topic.

Crossword puzzle activity to recall essential junior high school mathematics terms.

Definition of a 'relation' as a rule that relates values from a domain to a range.

Explanation of 'ordered pair' and its significance in mathematics.

Clarification of 'domain' as the set of all input values in a function.

Illustration of how to identify the domain from a set of ordered pairs.

Definition of a 'set' as a collection of distinct objects sharing a common characteristic.

Identification of 'range' as the set of all output values in a function.

Explanation of what makes a relation a 'function' based on the one-to-one correspondence of x and y values.

Introduction to mapping diagrams as a method to illustrate functions.

Demonstration of how to determine if a mapping represents a function using the one-to-one rule.

Use of sets and roster notation to identify whether a set of ordered pairs is a function.

Application of the vertical line test (VLT) to determine if a graph represents a function.

Examples of real-life functions, such as the circumference of a circle being a function of its diameter.

Real-life application of functions in determining the length of a shadow based on a person's height.

Practical example of driving a car where location is a function of time.

Introduction of a 10-item assessment to test understanding of the lesson on functions.

Summary of key points to remember about functions, including their definition, illustrations, and real-life applications.

Transcripts

play00:01

hello there and welcome to

play00:03

our new lesson this video is for senior

play00:08

high school

play00:08

general mathematics for grade 11.

play00:15

prepare the following a paper and a pen

play00:18

for you to write your answers or

play00:20

solutions

play00:21

for the problems later on and remember

play00:25

you can always pause and play this video

play00:28

whenever necessary you can even go back

play00:32

or revisit the portion of this video to

play00:34

clarify some things

play00:36

for mastery purposes i hope that you are

play00:39

all excited for this so let's hop in

play00:43

this video presentation is for the first

play00:46

quarter

play00:47

module 1 of our subject general

play00:50

mathematics

play00:51

for grade 11. the topic is

play00:55

real life functions to be specific

play00:59

this is for the first lesson about real

play01:02

life functions

play01:05

what you need to know we have three main

play01:09

objectives for this

play01:11

session the first one is we are going to

play01:13

determine functions and relations

play01:17

second illustrate functions through

play01:19

mapping diagrams

play01:21

sets and graphs and finally you're going

play01:24

to represent

play01:25

real life situations using functions

play01:30

what's in what you see on the screen

play01:32

right now

play01:33

is a crossword puzzle exactly

play01:37

we have here five descriptions of

play01:40

different terms

play01:41

that is related to your junior high

play01:44

school mathematics

play01:45

these are necessary terms for us to

play01:47

proceed with our new lesson

play01:50

okay so you can pause this video

play01:53

and try to recall those important terms

play01:56

i'll give you time go ahead pause the

play01:59

video

play02:00

are you done that sounds great so let's

play02:04

reveal the answers so for number one

play02:07

let's have number one down

play02:10

a rule that relates values from a set of

play02:13

values which we call as domain

play02:15

to a second set of values which we call

play02:18

as range

play02:19

what do you think the answer is

play02:22

relation so let's put it in our

play02:25

crossword puzzle

play02:26

relation there

play02:29

number three three down blank

play02:32

pair pair of objects taken

play02:36

in a specific order what do you call

play02:39

this

play02:40

blank pair the answer is it's an

play02:43

ordered pair very good so let's put it

play02:46

in our crossword puzzle now to clarify

play02:49

about

play02:50

ordered pairs we have here an example

play02:54

remember that ordered pairs are a

play02:56

sequence of two elements

play02:58

like for this example one and two they

play03:01

are enclosed in a parenthesis and they

play03:04

are separated by a comma

play03:07

okay that's an ordered pair let's

play03:10

proceed to the next one

play03:12

how about across number two the set of

play03:15

all x or input values can you recall

play03:19

you have there your clues o and i for

play03:22

the second and the second to the last

play03:24

letter

play03:25

and the answer is domain right

play03:28

brilliant domain let's review about

play03:31

domain

play03:33

when we say domain look at the example

play03:35

we have four sets

play03:37

or we have four ordered pairs in this

play03:39

set

play03:40

one seven two six three five

play03:43

and four four now what is our domain

play03:47

here

play03:48

our domain are the first elements inside

play03:51

the parenthesis or first element in each

play03:54

of the ordered pairs

play03:56

so that means it's 1 2 3

play03:59

and four which serves as our domain

play04:05

how about for number four across

play04:08

collection of well-defined

play04:10

and distinct objects called elements

play04:13

that share a common characteristic

play04:16

you have this when you're still in grade

play04:18

seven the answer is

play04:21

well done that's set s84

play04:25

set last one

play04:28

across number five the set of all y

play04:32

or output values what do you call that

play04:35

your clue there is it ends with letter e

play04:39

you already have the domain this is the

play04:42

pair of domain

play04:43

that means we are referring to the range

play04:46

okay we have completed our crossword

play04:48

puzzle but before that let's clarify on

play04:50

range

play04:51

now using the same example for the

play04:53

domain

play04:54

we have here this set of ordered pairs

play04:57

we already have one two three four as

play04:59

our domain earlier right

play05:01

now this time the range is these values

play05:05

the second element of each ordered pair

play05:08

or the y values that will be 7

play05:11

6 5 and 4 in this example

play05:16

what's new what makes relation

play05:21

a function

play05:24

a function is a special kind of relation

play05:28

because it follows an extra rule

play05:31

just like a relation a function is also

play05:35

a set of ordered pairs however

play05:39

take note of this every x

play05:42

value must be associated to

play05:45

only one y value i repeat

play05:49

every x value must be associated

play05:54

to only one y value that's the most

play05:57

important part of this lesson

play05:59

remember that that's for the definition

play06:02

of our function

play06:04

illustrations will help us a lot to

play06:07

learn

play06:08

functions easily so we have here mapping

play06:11

sets and graphing a function is a

play06:14

special type of relation

play06:16

always remember that in which each

play06:19

element

play06:20

of the domain is paired with exactly

play06:23

one element in the range a mapping

play06:26

shows how the elements are paired

play06:30

it's like a flowchart for a function

play06:33

showing the input and the output of

play06:35

values

play06:36

like this the domain for the first set

play06:40

and the range for the second set now in

play06:43

this

play06:43

mapping let's identify if this is

play06:46

a function or not a function how do we

play06:50

do that

play06:51

recall every x

play06:54

value must be associated to

play06:57

only one y value so basing on that

play07:02

let's try to check if every element in

play07:04

our domain

play07:06

is associated to only one value in our

play07:09

range

play07:10

let's focus on this part our domain a

play07:13

is associated to roman numeral one

play07:17

so that's one is to one that's the

play07:19

correspondence

play07:20

second domain or second element b

play07:23

that is associated to only one

play07:26

y value that is roman numeral 2.

play07:30

here c third element

play07:33

of our domain is associated to

play07:36

or is being paired to only one value of

play07:39

y

play07:40

that is 3 or roman numeral 3. and lastly

play07:44

d in our domain is being paired

play07:47

with roman numeral 4 in our range

play07:50

so as you can see every element in our

play07:54

domain

play07:56

is being paired to only one value

play07:59

of y in our range so that

play08:02

means this example is

play08:07

correct this is a function

play08:11

let's look at example number two can you

play08:14

identify

play08:14

if the given is a function or not a

play08:17

function

play08:18

you may pause this video

play08:21

okay all right so how about this example

play08:26

this is still a function y

play08:30

looking at all the elements of our

play08:33

domain negative 3 is being paired to 0

play08:36

negative 1 is being paired to 4 2

play08:39

is being paired to 7 and 4 is being

play08:43

paired to 4.

play08:44

so this shows that every element in our

play08:47

domain

play08:47

is being mapped or is being paired to

play08:50

only one

play08:51

value in our range which means

play08:55

that if we have an input of negative

play08:56

three the output is only zero

play08:59

if we have an input of negative one the

play09:02

output is

play09:03

only four we don't have any other y

play09:06

values

play09:07

if we have an input of two therefore our

play09:09

output is seven

play09:11

if our input is four our output is also

play09:15

four this type of correspondence shows

play09:18

many is the one for this part we have

play09:20

two elements in our domain

play09:23

here that's negative one and four we

play09:26

have two elements in our domain

play09:28

that has the same value in our range

play09:30

take note

play09:31

what we are referring to in a function

play09:33

is we have

play09:35

every element in our domain is paired

play09:38

with

play09:38

one element in our range which means

play09:41

that for every input there's only one

play09:44

output this type of correspondence is

play09:46

considered

play09:47

as a function i hope that's clear so

play09:50

this is

play09:51

a function third example how about this

play09:54

is this a function or not a function you

play09:56

may pause this video

play09:59

and let's reveal this is not a function

play10:04

why earlier we saw

play10:07

many is the one correspondence right

play10:10

this time

play10:11

you call this type of correspondence

play10:13

recall your grade seven

play10:14

and grade eight mathematics in your

play10:17

junior high school

play10:18

this is for this element in our domain

play10:22

which is letter a

play10:23

it's being paired let's focus on that

play10:25

here

play10:26

that's our domain a it's being paired to

play10:30

one roman numeral 1 in the range at the

play10:33

same time

play10:34

the same element in the domain is being

play10:36

paired to

play10:38

roman numeral 3. now that means

play10:42

this element in the domain has two

play10:44

outputs

play10:45

one and three which is clearly a

play10:48

violation of the definition of our

play10:50

function right

play10:52

therefore basing on that element

play10:55

this example is

play10:58

not a function i hope i made that clear

play11:02

a is being paired to two values in our

play11:04

range

play11:06

we are done with the mapping again these

play11:08

are illustrations to help us out

play11:10

understand or identify if the given is a

play11:14

function

play11:14

so this time let's move on to sets sets

play11:18

in this example we will have rooster

play11:20

notation

play11:21

so we have a set of four ordered pairs

play11:24

beginning with two three

play11:28

four five five six

play11:31

and we have six seven now can you

play11:34

identify if this given set

play11:36

is a function or not a function

play11:40

now how do we do that let's identify

play11:42

first the x

play11:43

and the y elements in each ordered pair

play11:46

so for the first one here

play11:48

two is our x sub one three

play11:51

is our y sub one four is our second

play11:55

value of x in the second ordered pair

play11:58

five is our y sub two five

play12:01

is our x sub three in the third ordered

play12:03

pair

play12:04

six is our y sub three here

play12:07

in the fourth ordered pair this will

play12:09

serve as our

play12:11

x of four and this will be our y sub

play12:13

four which is seven

play12:15

now why is it important for us to

play12:18

identify

play12:19

our x and y's in each of the ordered

play12:22

pairs

play12:23

because these values in a domain

play12:28

are the critical values so identify if

play12:31

it's a function or not a function

play12:33

why look at this we have 2 4 5

play12:36

and 6 in the domain no x value

play12:40

is repeated so 2 is distinct from the

play12:44

rest of the domain that's

play12:45

4 5 and 6. thus we consider

play12:48

this as a function

play12:52

this set is a function remember that

play12:56

when there's no x value that has been

play12:58

repeated in the given set

play13:00

then that means it's a function second

play13:03

example

play13:04

this set we have three three four five

play13:07

five five and five four so again

play13:11

the first step is let's identify the x

play13:14

and the y

play13:14

elements like this followed by

play13:19

yes we are going to identify the domain

play13:22

so meaning all the x values in our

play13:24

ordered pairs

play13:25

we have 3 4 5 and 5.

play13:29

now notice that here 5

play13:32

is repeated that's the x value it's

play13:35

repeated for that element in our x or in

play13:39

our domain

play13:40

we do have two different outputs which

play13:43

is not

play13:43

anymore the definition of a function so

play13:46

this is

play13:47

not a function well done

play13:51

we are done with the second illustration

play13:53

for sets

play13:54

again we are done with mapping and we

play13:56

are done with sets now this time let's

play13:58

focus

play13:59

into another way that's for graphing

play14:03

how do we identify if the given graph is

play14:06

a function or not

play14:07

your clue there is being pointed it's

play14:10

vlt

play14:11

that would be our magic keyword to

play14:13

identify if the graph

play14:14

is a function or not how what do you

play14:17

mean by

play14:18

vlt vlt stands for

play14:22

vertical line test

play14:26

yes functions can also be determined in

play14:29

graphing we can use this vertical line

play14:32

test which is a special kind of test

play14:35

using imaginary vertical lines

play14:38

and to check if these vertical lines

play14:41

would touch the graph only

play14:45

once otherwise it is not a function

play14:48

what do i mean by that if the vertical

play14:51

line

play14:52

hits two or more points on the graph

play14:55

it is not considered a function

play14:59

let's look at some examples look at this

play15:01

graph

play15:02

how would we know if this graph is a

play15:05

function

play15:06

or not again what's our magic keyword

play15:09

we'll be using vlt that's the vertical

play15:13

line test

play15:15

right so that's it the blue line that

play15:18

you see on the screen right now

play15:19

that's an imaginary line yeah it's not

play15:22

part of the graph

play15:23

we just made that line to test if the

play15:26

given graph

play15:27

is a function or not i hope you're

play15:29

following

play15:30

so the point there is here which means

play15:34

that the line the vertical line touches

play15:37

the graph

play15:38

at that point only once

play15:41

now let's move the blue line let's move

play15:43

the blue vertical line

play15:45

because here you can check if it's a

play15:48

function

play15:48

if any point of the graph it would only

play15:51

touch

play15:51

the graph or the given graph once so

play15:54

let's move the vertical line

play15:56

how about there yes it only hits or it

play15:59

only touches the graph once

play16:02

how about there only once and finally

play16:05

right here yes it only touches the graph

play16:08

once hence we can say that the given

play16:11

graph

play16:12

is a function so that's an example of a

play16:15

function

play16:16

basing on the graph

play16:20

let's look at another example identify

play16:23

if this graph

play16:24

is a function or not a function i'll

play16:27

give you time

play16:28

you may pause this video to give

play16:30

yourself more time

play16:33

all right are you done let's check let's

play16:36

create

play16:37

our imaginary vertical line again we

play16:39

will be using

play16:40

vertical line test right there

play16:43

the black dot represents the point where

play16:46

in the vertical line touches your given

play16:49

wrath

play16:49

it's only once right let's move it a

play16:52

little bit to the right right there

play16:54

it touches the graph how many times

play16:57

still once

play16:58

let's move it there still once

play17:02

last one over there still it touches the

play17:05

graph

play17:06

once basing on that we can conclude that

play17:09

the given graph

play17:10

is indeed a function

play17:13

so that's an example of a function now

play17:16

let's practice more let's identify if

play17:19

these given graphs

play17:20

are functions or not a function again

play17:23

let's identify

play17:25

try these graphs you can pause this

play17:27

video right now

play17:28

and give yourself more time to

play17:30

scrutinize each of the graph

play17:32

and identify if it's a function or not

play17:36

a function go ahead

play17:43

[Music]

play17:45

okay so let's reveal the answers

play17:49

now based on the sixth graph we can

play17:51

actually create

play17:52

two groups and the first group consists

play17:55

of

play17:56

these two graphs

play17:59

now let's focus on this point

play18:02

right here for the first graph as you

play18:05

can see

play18:05

the vertical line touches the given

play18:07

graph once

play18:08

how about for the second graph there it

play18:11

only touches

play18:12

yes it touches the given graph same with

play18:15

the first graph

play18:16

only once let's try to move the vertical

play18:19

line

play18:20

to the right right there

play18:23

it touches still the same once let's

play18:26

move it more

play18:27

right there still touch us once

play18:31

and last one same result

play18:34

once thus we can conclude that these two

play18:37

graphs

play18:38

are considered as

play18:41

very good we consider this as functions

play18:47

so the remaining four graphs looks like

play18:49

this

play18:51

observe for the first graph we have here

play18:54

two points

play18:55

which means that the vertical line

play18:57

touches the graph or touches the given

play19:00

graph

play19:00

at two points however for the second

play19:03

graph this would be the first one

play19:05

and that would be the second one still

play19:07

the same it touches the given graph

play19:09

twice

play19:10

the vertical line touches the graph here

play19:13

at the same time here

play19:14

so that means there would be two points

play19:16

right and lastly we have here the last

play19:19

graph it touches the graph

play19:22

twice let's move the vertical line

play19:26

like this well observe

play19:29

that for the fourth graph you now have

play19:32

three points

play19:33

earlier it was only two this time as we

play19:36

move the vertical line it touches the

play19:38

graph at three points

play19:40

now for the first three graphs it's the

play19:42

same it touches the given graph twice

play19:45

let's move it there observe

play19:48

that in all these given graphs the

play19:51

vertical line

play19:52

touches the given graph more than once

play19:56

again that's more than once because for

play19:59

the first second and third graph

play20:01

it touches the graph twice for the

play20:03

fourth graph it touched us earlier the

play20:05

graph twice

play20:06

this time thrice it's more than once

play20:09

yes which makes all of these graphs

play20:12

not a function so these are examples of

play20:16

not a function

play20:20

so those are the illustrations again for

play20:23

the mapping

play20:24

sets and graph

play20:28

how about functions in real life

play20:31

this is a circle so an example of a

play20:34

function in real life

play20:36

is the circumference of a circle the

play20:39

circumference of a circle

play20:41

is a function of its diameter it can be

play20:43

represented as

play20:45

circumference or c of d is equal to d

play20:48

pi alternatively we can also use it

play20:52

as a function of radius which is c of

play20:55

r is equal to two pi r

play20:59

[Music]

play21:00

another example is a shadow the length

play21:04

of a person's shadow

play21:06

along the floor is a function of their

play21:09

height

play21:10

and the third example is driving a car

play21:14

when driving a car your location

play21:18

is a function of time

play21:23

what's more i prepared here a 10 item

play21:27

assessment

play21:28

first to check your understanding for

play21:30

our lesson for today

play21:31

let's try to have a closer look you can

play21:35

pause this video or you can even take a

play21:37

screenshot and answer it later during

play21:39

your available time

play21:41

so we have your items one two and three

play21:43

again you may pause or take a screenshot

play21:46

[Music]

play21:49

okay let's move on the next set is for

play21:52

items four to six

play22:00

next we have seven to nine

play22:03

again you may take a screenshot or pause

play22:06

this video

play22:10

and finally we have item number 10.

play22:14

[Music]

play22:18

if you're using the same mode you'll do

play22:20

not forget to submit your answers to

play22:22

your teacher on your agreed date and

play22:24

time

play22:26

[Music]

play22:27

what you need to remember a relation

play22:30

is a function when every x value is

play22:33

associated to only one y value

play22:37

do not forget that you can illustrate

play22:40

functions

play22:41

through graphing mapping or sets

play22:45

and lastly functions can be seen in our

play22:48

daily lives like driving a car

play22:51

wherein your location is a function of

play22:54

time

play22:54

the length of your shadow which is a

play22:57

function

play22:57

of one's height and a lot more

play23:01

and that's it we are done with the first

play23:03

lesson

play23:04

for this topic functions for our general

play23:07

mathematics subject

play23:09

great job for today see you in the next

play23:12

lesson

Rate This
β˜…
β˜…
β˜…
β˜…
β˜…

5.0 / 5 (0 votes)

Related Tags
High School MathGeneral MathematicsGrade 11Real Life FunctionsEducational VideoMath ConceptsDomain and RangeMapping DiagramsGraphing FunctionsVertical Line Test