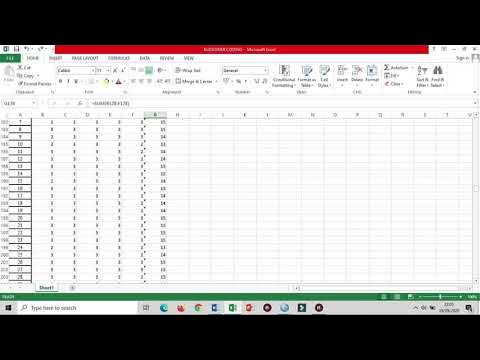
Using Google Sheets to Calculate Measures of Central Tendency
Summary
TLDRThis video tutorial offers a step-by-step guide on utilizing Google Sheets for calculating statistical measures such as mean, median, mode, and range. It simplifies the process by demonstrating how to set up formulas for quick calculations. The video illustrates inserting functions like 'average' and 'median' directly or by typing them into cells. It also covers sorting data to identify the mode and calculate the range, emphasizing the importance of performing this step last to avoid disrupting data relationships. The tutorial aims to enhance efficiency in data analysis using Google Sheets.
Takeaways
- 📊 Use Google Sheets to calculate statistical measures like mean, median, mode, and range with ease.
- 🔍 Insert functions in Google Sheets by going to 'Insert' > 'Function' or by typing '=' and starting to type the function name.
- 📈 To find the mean, use the 'AVERAGE' function and select the range of cells you want to calculate the mean for.
- 📋 Copy and paste the mean formula to other columns or sheets to quickly calculate additional means.
- 🔢 For the median, use the 'MEDIAN' function and select the appropriate cells to find the middle value of the dataset.
- 📑 After performing all necessary calculations, sort the data to identify the mode and range.
- 🔃 Sorting data in Google Sheets can be done by highlighting the cells and using the 'Data' > 'Sort' option.
- 📉 To calculate the range, sort the data first to arrange it from smallest to largest, then subtract the smallest value from the largest.
- 🔑 Remember to sort the data last after all calculations are complete to avoid disrupting the data's original order.
- 🔍 The 'MODE' function can also be used to find the most frequently occurring number in a dataset.
Q & A
What is the main topic of the video?
-The main topic of the video is teaching viewers how to use Google Sheets to calculate statistical measures such as mean, median, mode, and range.
How does the video suggest finding the mean in Google Sheets?
-The video suggests inserting a formula for the mean by either going to 'Insert' then 'Function' and selecting 'Math' or 'Statistical', or by typing an equal sign followed by 'average' and selecting the range of cells to calculate the mean.
What keyboard shortcut is used to copy a formula in Google Sheets according to the video?
-The video mentions using 'Ctrl C' to copy a formula in Google Sheets.
How can you apply the copied formula to other columns or sheets in Google Sheets?
-After copying the formula with 'Ctrl C', you can paste it into other columns or sheets as needed by using the 'Paste' option or the 'Ctrl V' keyboard shortcut.
What is the recommended method for finding the median in the video?
-The video recommends finding the median by inserting a formula or typing an equal sign followed by 'median' and then selecting the range of cells to calculate the median.
Why should sorting data be done at the end of data analysis in Google Sheets?
-Sorting data should be done at the end of data analysis because it rearranges the data, which could disrupt any previously calculated relationships or associations between data points.
How does the video demonstrate sorting data in Google Sheets?
-The video demonstrates sorting data by highlighting the numbers to be sorted, going to the 'Data' tab, and selecting 'Sort range' to sort the data in ascending order from smallest to largest.
What is the easiest way to calculate the mode according to the video?
-The easiest way to calculate the mode, as per the video, is to sort the data and visually identify the most common number, or by using a formula that calculates the mode.
How can you calculate the range in Google Sheets after sorting the data?
-After sorting the data, the range can be calculated by subtracting the smallest value from the largest value, or by using a formula that automatically calculates the difference between the maximum and minimum values in a given range.
What is the video's overall advice for using Google Sheets formulas?
-The video advises using Google Sheets formulas to automate and expedite the process of calculating statistical measures, thus making the task easier and more efficient.
Outlines

هذا القسم متوفر فقط للمشتركين. يرجى الترقية للوصول إلى هذه الميزة.
قم بالترقية الآنMindmap

هذا القسم متوفر فقط للمشتركين. يرجى الترقية للوصول إلى هذه الميزة.
قم بالترقية الآنKeywords

هذا القسم متوفر فقط للمشتركين. يرجى الترقية للوصول إلى هذه الميزة.
قم بالترقية الآنHighlights

هذا القسم متوفر فقط للمشتركين. يرجى الترقية للوصول إلى هذه الميزة.
قم بالترقية الآنTranscripts

هذا القسم متوفر فقط للمشتركين. يرجى الترقية للوصول إلى هذه الميزة.
قم بالترقية الآنتصفح المزيد من مقاطع الفيديو ذات الصلة

STATISTIKA: Ukuran gejala pusat dan ukuran letak 1

Mode, Median, Mean, Range, and Standard Deviation (1.3)

UKURAN PEMUSATAN DATA BERKELOMPOK | Rataan Median Modus Kuartil Desil Persentil

Statistika - Ukuran Pemusatan Data (Mean, Median, Modus)

Cara menyusun tabel distribusi frekuensi, menentukan mean, median dan modus data kelompok

cara mencari mean, median dan mode dari awal kuesioner, tabulasi dan menggunakan spss sampai hasil
5.0 / 5 (0 votes)
