35. Regressione Lineare Semplice (Spiegata passo dopo passo)
Summary
TLDRThe script provides an in-depth explanation of simple linear regression, focusing on the relationship between two variables: a dependent variable (Y) and an independent variable (X). It explains how regression is used to find a function that expresses the average dependence between the variables. The process involves calculating the regression line using the least squares method, minimizing the distance between observed and theoretical values. The script also discusses the interpretation of parameters like the intercept and slope, as well as the practical applications and limitations of these calculations in real-world scenarios.
Takeaways
- 📊 Regression analysis studies the average dependence between two phenomena, seeking a function that expresses this average dependence.
- 📈 Simple linear regression focuses on the average dependence of the dependent variable 'y' on the independent variable 'x', also known as the explanatory or antecedent variable.
- 🔍 The regression line is calculated to represent the average dependence of 'y' on 'x', and it is formulated using the equation \( y^{\hat{}} = a + b \cdot x \), where 'a' is the intercept and 'b' is the slope.
- 🏠 An example given in the script involves observing the number of family members and annual savings in euros to see if there is a relationship between family size and savings.
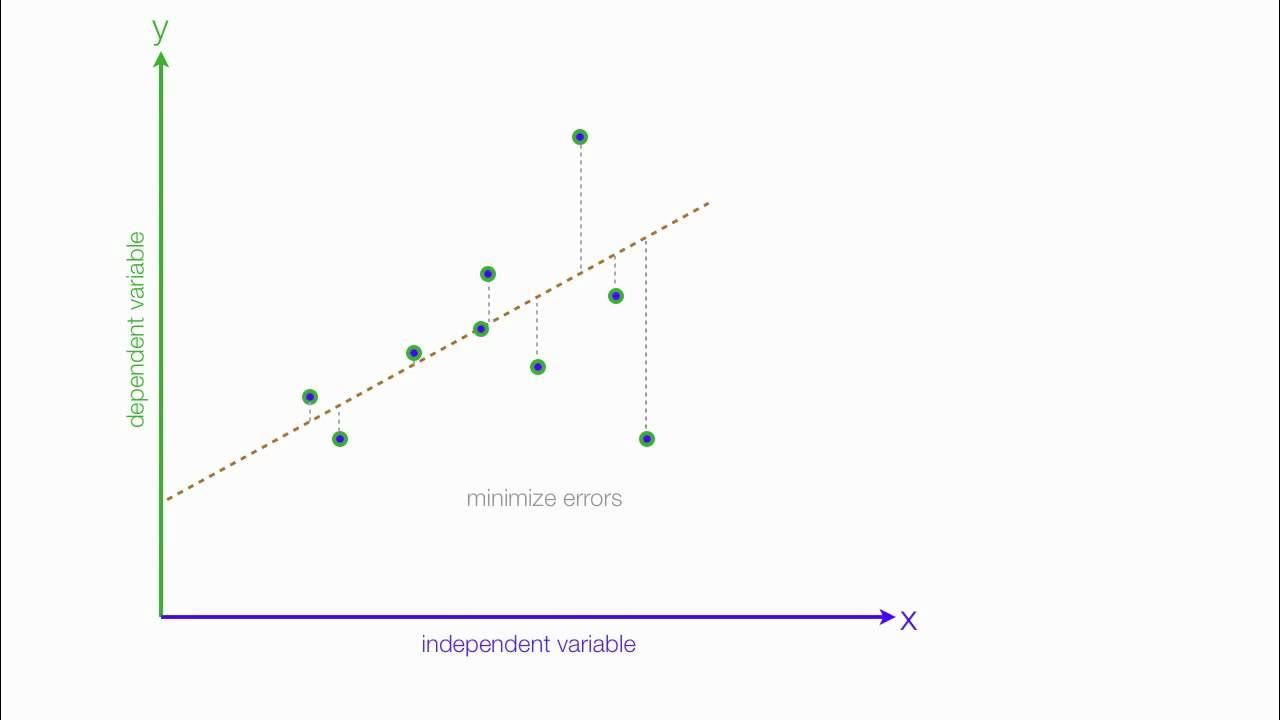
- 📊 A scatter plot is used to represent the relationship, with the independent variable (number of family members) on the horizontal axis and the dependent variable (savings in euros) on the vertical axis.
- 📉 The regression line is calculated using the least squares method, which minimizes the sum of the squared differences between the observed values and the values predicted by the line.
- ✏️ The coefficients 'a' (intercept) and 'b' (slope) are calculated using the formulas derived from the least squares method, which involve summations and averages of the observed values.
- 🔢 The intercept 'a' indicates the expected value of 'y' when 'x' is zero, which might not always have practical sense.
- 📈 The slope 'b' indicates how 'y' changes on average as 'x' increases by one unit, providing insight into the relationship between the variables.
- 📋 The script also discusses weighted regression, where both variables and their frequencies are considered in the calculations, which is useful when dealing with non-uniform data distributions.
Q & A
What is the main focus of the script?
-The script focuses on explaining the concept of regression analysis, specifically simple linear regression, and how it is used to study the average dependency between two phenomena.
What is the difference between a dependent and an independent variable in the context of regression analysis?
-In regression analysis, the dependent variable (denoted as 'y') is the variable that is being predicted or explained, while the independent variable (denoted as 'x') is the variable used to predict or explain the dependent variable.
What is simple linear regression and why is it called 'simple'?
-Simple linear regression is a statistical method that studies the average dependency of a dependent variable 'y' from a single independent variable 'x'. It is called 'simple' because it involves only one independent variable.
How is the relationship between the dependent and independent variable visualized in simple linear regression?
-The relationship is visualized through a scatter plot, with the independent variable on the horizontal axis and the dependent variable on the vertical axis. The regression line, which represents the average dependency, is then plotted on this scatter plot.
What are the two parameters of the regression line and what do they represent?
-The two parameters of the regression line are the intercept (a) and the slope (b). The intercept represents the expected value of the dependent variable when the independent variable is zero, and the slope represents the average change in the dependent variable for a one-unit increase in the independent variable.
What does the script mean by 'devianza' and how is it calculated?
-In the script, 'devianza' refers to the sum of the squared differences between the observed values and the values predicted by the regression line. It is calculated as the sum of (xi - mean of x)^2 for the independent variable and (yi - mean of y)^2 for the dependent variable.
How is the regression line calculated?
-The regression line is calculated using the method of least squares, which minimizes the sum of the squared differences between the observed values and the values predicted by the regression line. This involves setting up a system of equations by taking the derivatives of the sum of squared differences with respect to the parameters a and b, and then solving for these parameters.
What is the significance of the slope (b) in the context of the regression line?
-The slope (b) of the regression line indicates the direction and strength of the relationship between the independent and dependent variables. A positive slope suggests a direct relationship, where an increase in the independent variable is associated with an increase in the dependent variable. A negative slope indicates an inverse relationship.
Why might the intercept (a) in a regression analysis not make practical sense?
-The intercept (a) might not make practical sense when it represents a value that is not possible or meaningful in the context of the study. For example, predicting a certain amount of savings when the number of family members is zero does not have a practical interpretation.
How does the script differentiate between calculating regression parameters for unweighted and weighted data?
-The script differentiates by showing that for unweighted data, the calculation of the regression parameters involves summing the products of the independent and dependent variables and their respective means. For weighted data, the values are adjusted by their frequencies, meaning each data point is multiplied by its frequency before being summed.
Outlines

هذا القسم متوفر فقط للمشتركين. يرجى الترقية للوصول إلى هذه الميزة.
قم بالترقية الآنMindmap

هذا القسم متوفر فقط للمشتركين. يرجى الترقية للوصول إلى هذه الميزة.
قم بالترقية الآنKeywords

هذا القسم متوفر فقط للمشتركين. يرجى الترقية للوصول إلى هذه الميزة.
قم بالترقية الآنHighlights

هذا القسم متوفر فقط للمشتركين. يرجى الترقية للوصول إلى هذه الميزة.
قم بالترقية الآنTranscripts

هذا القسم متوفر فقط للمشتركين. يرجى الترقية للوصول إلى هذه الميزة.
قم بالترقية الآنتصفح المزيد من مقاطع الفيديو ذات الصلة

Regression and R-Squared (2.2)

[Mathematics in the Modern World] Correlation & Simple Linear Regression

Modul 12 (StatSos2) - Konsep Dasar Regresi Linear Sederhana

PERBEDAAN REGRESI LINEAR SEDERHANA DAN REGRESI BERGANDA

REGRESSION AND CORRELATION EDDIE SEVA SEE

An Introduction to Linear Regression Analysis
5.0 / 5 (0 votes)
