Understanding Power Spectral Density and the Power Spectrum
Summary
TLDRThe video explains how to interpret and scale a Fast Fourier Transform (FFT) to gain meaningful insights about a time domain signal. It covers converting an FFT into amplitude, power, and power spectral density representations. The choice of representation depends on the analysis goal and signal characteristics. Key factors are using a rectangular window, ensuring a stationary signal, and accounting for spectral leakage. With the right approach, the FFT can reveal a signal's dominant frequencies and power spectrum. However, broadband signals require looking at power spectral density. Overall, matching the FFT analysis technique to the signal and end goal enables gaining accurate, physically meaningful insights.
Takeaways
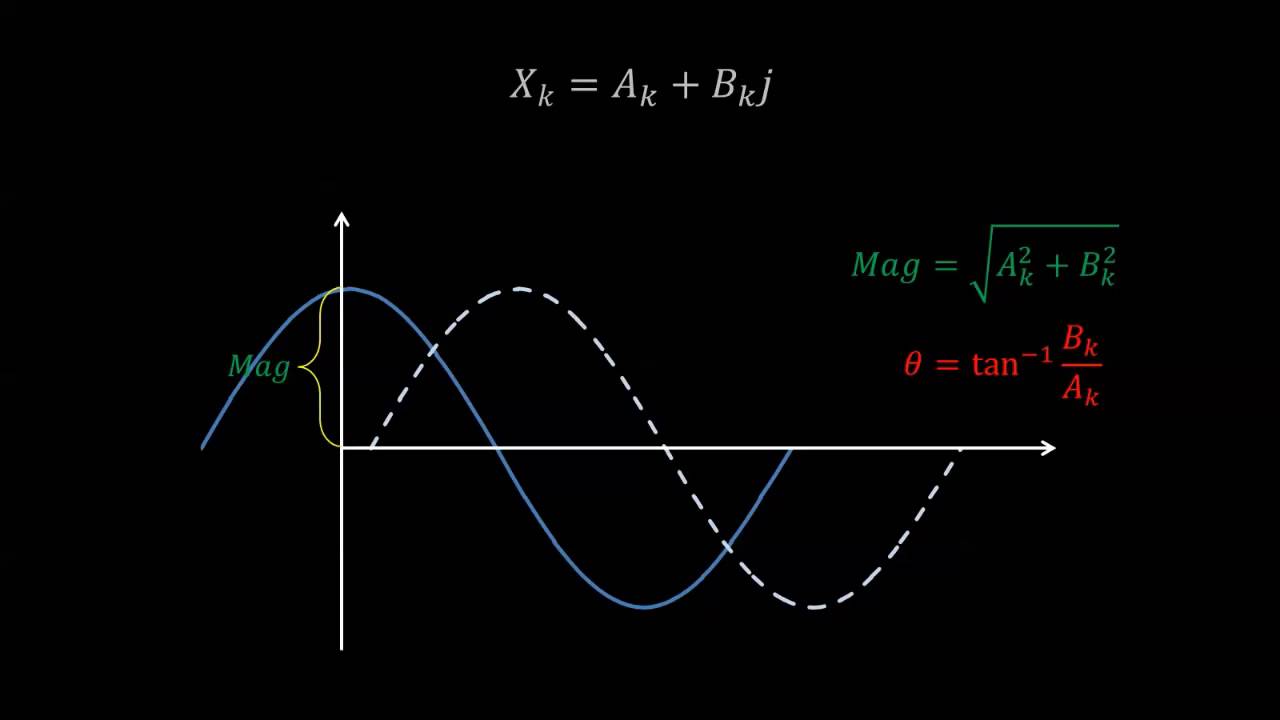
- 😀 The FFT transforms a time signal into a vector of complex numbers representing the signal's phase and magnitude at different frequencies.
- 👍 Scaling the FFT properly is key to understanding time domain signal properties from the frequency domain.
- 🤔 Choosing how to scale the FFT depends on your analysis goal - amplitude, power, power spectral density etc.
- 💡 Taking the absolute FFT value divided by N gives the amplitude. Squaring that result gives the power.
- ⚠️ Those equations only hold for rectangular windows on stationary, discrete spectra signals.
- 🔍 The power spectrum shows power of dominant sine waves. The power spectral density works better for broadband signals.
- 😕 Using the wrong FFT scaling leads to misleading results about time domain properties.
- 📈 Longer FFT windows reduce spectral leakage but limit frequency resolution.
- 🌄 The periodogram function handles windowing and scaling automatically.
- 💯 Understanding signal characteristics and analysis goals allows proper interpretation of FFT results.
Q & A
What is the purpose of doing spectral analysis?
-The purpose is to understand quantitative properties of the signal in the frequency domain, such as the amplitude of sine waves at particular frequencies. The analysis method depends on your specific goal.
Why do we divide the FFT by N to get the amplitude?
-Dividing by N gives us the average amplitude across the window. This works because of the mathematical derivation of the discrete Fourier transform and properties of sine waves.
When can we use the power spectrum equations for amplitude and power?
-The equations are only valid when using a rectangular window, the signal is stationary within the window, and the signal has a discrete frequency spectrum.
How does window size affect the power spectrum?
-A longer window reduces spectral leakage but also reduces frequency resolution. Windowing affects amplitude and power calculations.
What is spectral leakage and how can it be reduced?
-Spectral leakage occurs when the signal period is not an integer multiple of the window length. It can be reduced by using a longer window or applying a non-rectangular window.
What is power spectral density and when should it be used?
-Power spectral density normalizes the power spectrum. It should be used for signals with a continuous frequency spectrum rather than discrete spectral components.
How do you calculate the equivalent noise bandwidth?
-The equation squares each window term, sums them, multiplies by the sample rate, and divides by the sum of window terms squared.
What does the power spectrum of a window represent?
-It shows the attenuation of nearby frequencies that will blend together and contribute to each frequency sample.
Why can't power be accurately calculated when frequencies are too close?
-Too close frequencies merge into a single peak that represents their combined power rather than individual power.
How can the periodogram function be used?
-The periodogram function conveniently outputs the power spectrum or power spectral density and handles window normalization automatically.
Outlines

此内容仅限付费用户访问。 请升级后访问。
立即升级Mindmap

此内容仅限付费用户访问。 请升级后访问。
立即升级Keywords

此内容仅限付费用户访问。 请升级后访问。
立即升级Highlights

此内容仅限付费用户访问。 请升级后访问。
立即升级Transcripts

此内容仅限付费用户访问。 请升级后访问。
立即升级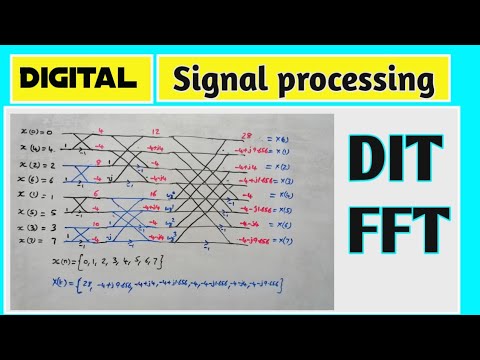


5.0 / 5 (0 votes)
