Active Low Pass Filter - EXPERIMENT

Phys Whiz
1 Feb 201611:18

Summary

TLDRThis video tutorial demonstrates the operation of an active low-pass filter, which allows signals below a certain frequency to pass through. The presenter uses a circuit with an operational amplifier (op-amp) in inverting mode, with R2 and C components to create the filter. The critical frequency formula is provided as 1/(2πR2C). The video includes a practical setup, input signal testing at various frequencies, and a visual comparison of the input and output signals. The presenter also discusses the Butterworth filter characteristics and the expected gain at the cutoff frequency, concluding with a graph plotting the gain versus frequency to verify the filter's performance.

Takeaways

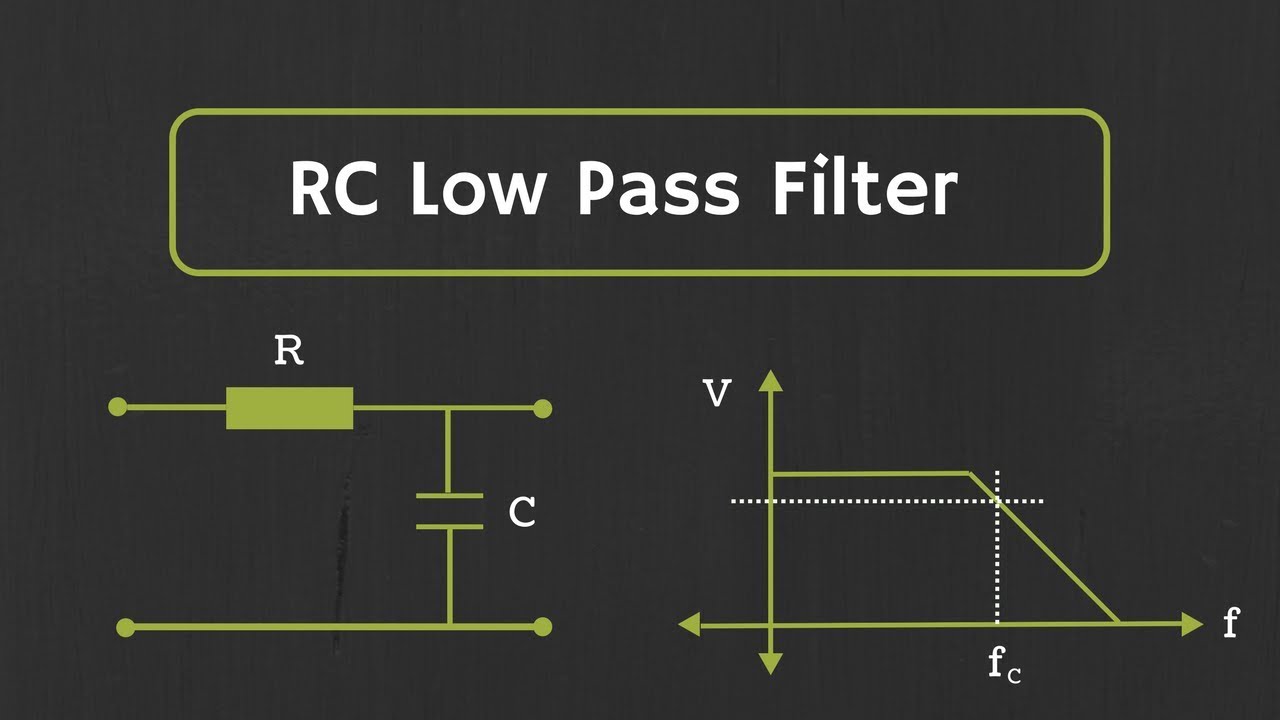
  • 🎛️ The video demonstrates the working of an active low-pass filter, which only allows signals with frequencies lower than a certain cutoff frequency to pass through.
  • 🔌 The active low-pass filter in the video uses an operational amplifier (op-amp) in an inverting configuration.
  • 🛠️ The circuit shown uses a 741 C operational amplifier IC, with the input signal given through the inverting terminal (pin 2).
  • 🧮 The formula for the cutoff frequency (critical frequency) of an active low-pass filter is given by 1 / (2πR2C).
  • 📊 The video discusses the characteristics of a first-order active low-pass filter, also known as a Butterworth filter.
  • 📉 The Butterworth filter has a flat response in the passband and falls off at a rate of 20 dB per decade after the cutoff frequency.
  • 🔍 At the cutoff frequency, the gain is approximately -3 dB, which corresponds to about 70.7% of the input voltage.
  • 🔄 The video shows a practical demonstration, where the input signal is compared to the output signal using a digital storage oscilloscope (DSO).
  • 🔧 The experiment involves varying the input frequency and measuring the corresponding output signal to plot a gain vs. frequency graph.
  • 📈 The video emphasizes the importance of taking multiple readings at different frequencies to get a smooth and accurate gain vs. frequency curve.

Q & A

  • What is the primary function of a low pass filter?

    -A low pass filter allows signals with frequencies lower than a certain critical frequency to pass through while blocking higher frequencies.

  • What distinguishes an active low pass filter from a passive one?

    -An active low pass filter contains active components such as an operational amplifier, which amplifies the input signal, in contrast to a passive filter that does not use active components.

  • What is the significance of the operational amplifier being used in inverting mode in the given circuit?

    -The operational amplifier in inverting mode inverts the phase of the input signal, which is a characteristic of the active low pass filter design demonstrated in the script.

  • What is the formula for calculating the critical or cutoff frequency of an active low pass filter?

    -The formula for calculating the cutoff frequency is \( \frac{1}{2\pi R_2C} \), where \( R_2 \) is the resistance and \( C \) is the capacitance in the filter circuit.

  • What type of filter is the demonstrated circuit known as, and what are its characteristics?

    -The demonstrated circuit is known as a first-order active low pass filter or Butterworth filter, characterized by a flat response region and a roll-off rate of 20 decibels per decade after the cutoff frequency.

  • At what frequency does the gain of the filter drop to about minus 3 decibels?

    -The gain of the filter drops to about minus 3 decibels at the cutoff frequency.

  • What is the practical significance of the cutoff frequency in the context of the experiment?

    -The cutoff frequency is the point at which the filter's output voltage is approximately 70.7% of the input voltage, marking the transition from the passband to the stopband.

  • What are the values of R2 and C used in the circuit for the experiment?

    -The R2 resistance used in the circuit is 1 kilo-ohm, and the capacitance C is 0.01 microfarads.

  • How does the output voltage of the filter change as the input frequency increases beyond the cutoff frequency?

    -As the input frequency increases beyond the cutoff frequency, the output voltage decreases, indicating the filter's effectiveness in attenuating higher frequencies.

  • What is the recommended approach for verifying the performance of the active low pass filter?

    -The recommended approach is to take multiple readings of the output voltage at various frequencies, both below and above the cutoff frequency, and then plot the gain versus frequency or output voltage versus frequency to verify the filter's performance.

  • How can viewers with questions or doubts about the experiment get assistance?

    -Viewers can leave their questions or doubts in the comment section of the video, and the presenter will get back to them.

Outlines

00:00

🔧 Demonstration of an Active Low Pass Filter

The video begins with an introduction to the concept of an active low pass filter, which allows signals below a certain frequency to pass through and is distinguished by the presence of active components like an operational amplifier. The presenter uses a specific circuit diagram that includes an op-amp in inverting mode, with R2 and C components to form the filter. The critical frequency, or cutoff frequency, is calculated using the formula \( \frac{1}{2\pi R2C} \). The video also explains that this type of filter is known as a first-order active low pass filter or a Butterworth filter, characterized by a flat response and a 20 dB per decade roll-off after the cutoff frequency. The presenter mentions a previous tutorial for more theoretical details and proceeds to a practical demonstration of the filter's operation.

05:01

📊 Testing the Active Low Pass Filter with Various Frequencies

The presenter tests the active low pass filter by applying a 20 Hz input signal and observing the output on a digital storage oscilloscope (DSO). The output signal is in phase opposition to the input due to the inverting configuration of the op-amp. The video continues with testing at various frequencies, including the critical frequency of approximately 16 kHz, where the output voltage is expected to be 70.7% of the input. The presenter measures the output voltage at different frequencies, noting the expected behavior around the cutoff frequency. The goal is to collect data points to plot a gain versus frequency graph, which will later be used to verify the filter's performance.

10:01

📈 Plotting the Gain vs. Frequency Graph and Conclusion

After collecting numerous readings of output voltage at frequencies below and above the critical frequency, the presenter plots the gain in decibels against the logarithm of frequency on a graph. The resulting curve is smooth and closely matches the theoretical plot, demonstrating the effectiveness of the active low pass filter. The video concludes with a reminder to ensure that the output voltage at the cutoff frequency is approximately 70.7% of the input, which is confirmed by the experiment. The presenter invites viewers to ask questions or share doubts in the comments section and thanks them for watching.

Mindmap

Keywords

💡Active Low Pass Filter

An active low pass filter is an electronic circuit that allows signals with frequencies lower than a certain critical frequency to pass through while attenuating higher frequencies. It is termed 'active' because it includes active components like operational amplifiers. In the video, the presenter demonstrates how to construct and test an active low pass filter using an op-amp in inverting mode, which is a key concept for understanding the filter's operation.

💡Operational Amplifier (Op-Amp)

An operational amplifier is a high-gain electronic voltage amplifier with differential input and usually a single-ended output. It is used in the active low pass filter to amplify the input signal, making it an active component. The script mentions the use of a 741C operational amplifier, which is a specific type of op-amp, to create the active filter.

💡Critical Frequency

The critical frequency, also known as the cutoff frequency, is the frequency at which the filter's gain drops to -3 dB, which is approximately 70.7% of the maximum gain. In the script, the presenter calculates the theoretical cutoff frequency using the formula 1/(2πR2C) and verifies it through experimentation.

💡Inverting Configuration

In the context of the video, inverting configuration refers to the way the operational amplifier is connected, where the input signal is applied to the inverting terminal, causing the output signal to be 180 degrees out of phase with the input. This is demonstrated in the script when the presenter shows the operational amplifier's setup in the circuit.

💡First-Order Active Low Pass Filter

A first-order active low pass filter is a type of filter that provides a certain amount of attenuation for frequencies above the cutoff frequency. The script mentions that the filter being demonstrated is a first-order filter, which is also known as a Butterworth filter due to its flat response in the passband.

💡Butterworth Filter

A Butterworth filter is a type of signal processing filter characterized by a maximally flat frequency response in the passband. The video script describes the filter's response as 'almost flat' in the passband and falling off at a rate of 20 decibels per decade after the cutoff frequency, which is a characteristic of a Butterworth filter.

💡Gain

In the context of filters, gain refers to the ratio of the output signal's amplitude to the input signal's amplitude. The script discusses measuring the output voltage at various frequencies to plot the gain versus frequency graph, which is crucial for understanding the filter's performance.

💡Decibels (dB)

Decibels are a logarithmic unit used to express the ratio of two values of a physical quantity, often power or intensity, in this case, the gain of the filter. The script mentions plotting the gain in decibels on the y-axis, which is a standard way to represent the filter's attenuation characteristics.

💡Frequency Response

The frequency response of a filter is a plot of the filter's gain or output amplitude as a function of frequency. In the script, the presenter discusses plotting the gain in decibels against the logarithm of the frequency to visualize the filter's performance and verify the theoretical design.

💡Digital Storage Oscilloscope (DSO)

A digital storage oscilloscope is an electronic test instrument that allows the observation, analysis, and recording of various electrical signals. In the video, the DSO is used to observe the input and output signals of the active low pass filter, providing visual evidence of the filter's operation.

💡Cutoff Frequency

The cutoff frequency is the point at which the filter's gain drops to a specific level, typically -3 dB below the maximum gain. The script includes a practical demonstration of measuring the output voltage at the cutoff frequency and comparing it to the theoretical calculations.

Highlights

Introduction to the concept of an active low pass filter, which allows signals below a certain critical frequency to pass through.

Explanation of the active low pass filter circuit using an operational amplifier in inverting mode.

Description of the circuit components, including R2 resistance and C capacitance, which form the active low pass filter.

Presentation of the formula for calculating the critical or cutoff frequency of an active low-pass filter.

Identification of the filter as a first-order active low pass filter or Butterworth filter due to its specific frequency response characteristics.

Demonstration of the filter's response with a graph showing a flat region and a 20 decibels per decade falloff after the cutoff frequency.

Mention of the gain at the cutoff frequency being about minus 3 decibels with potential for slight experimental error.

Recommendation to watch another tutorial for a deeper understanding of the formula and frequency response graph.

Overview of the experimental setup for the active low pass filter circuit with a power supply for the operational amplifier.

Comparison of the experimental setup with the circuit diagram for clarity.

Application of a 20 Hertz input signal to the filter and observation of the output on a digital storage oscilloscope.

Observation of the phase difference between input and output signals due to the inverting configuration of the operational amplifier.

Process of measuring the output signal amplitude at various frequencies to plot the gain versus frequency graph.

Disclosure of the values of R2 resistance and C capacitance used in the circuit for reference.

Calculation of the theoretical cutoff frequency using the provided formula and comparison with experimental results.

Demonstration of the output voltage at the cutoff frequency and its comparison with the theoretical 70.7% of the input voltage.

Incremental increase of input frequency to observe the decrease in output voltage, illustrating the filter's behavior beyond the cutoff frequency.

Instruction to take multiple readings to plot a smooth curve of gain in decibels versus log of frequency.

Presentation of the final plotted curve matching the theoretical plot, demonstrating the successful experiment.

Invitation for viewers to ask questions or share doubts in the comment section for further clarification.

Transcripts

play00:00

hey guys how's it going and in this

play00:02

video I'm going to demonstrate the

play00:04

working of an active low pass filter now

play00:07

by definition a low pass filter only

play00:10

allows signals with frequencies lower

play00:13

than a certain critical frequency to

play00:16

pass through it and if the filter

play00:19

contains any active components such as

play00:21

an op-amp that is an operational

play00:24

amplifier then there is known as an

play00:26

active low pass filter now to make the

play00:30

active low pass filter I use this

play00:32

particular circuit that you are seeing

play00:34

on your screen now and the peculiar

play00:37

thing about this circuit diagram is that

play00:39

it uses the operational amplifier right

play00:41

here in an inverting mode as you can see

play00:45

that the input is given through the

play00:46

inverting terminal that is the second

play00:49

terminal of the 741 C operational

play00:52

amplifier IC and free it's pretty basic

play00:57

actually it's just a low-pass filter

play00:59

circuit and using the R 2 and C and then

play01:04

they have added an operational amplifier

play01:07

to just amplify the input signal and

play01:11

thus making the low pass filter

play01:13

containing r2 resistance and the C

play01:16

capacitance as an active low pass filter

play01:20

now the formula for the critical

play01:23

frequency or the cutoff frequency of an

play01:25

active low-pass filter is given by 1 by

play01:29

2 PI R 2 C and you can see that R 2 is

play01:33

the resistance right here and sees this

play01:36

capacitance right here so you can use

play01:40

this formula to calculate what your trip

play01:42

theoretical cutoff frequency should be

play01:45

and then after you design

play01:48

active low-pass filter and you can

play01:50

verify if you are getting the same

play01:52

results as I'm going to be doing in a

play01:56

few moments from now now this particular

play01:59

low-pass filter that I'm showing you is

play02:01

also known as a first-order active low

play02:04

pass filter or Butterworth filter

play02:06

because if you take the input for a

play02:11

variety of frequency and plot the key

play02:13

versus those frequencies on a graph then

play02:17

you get a graph of somewhat this kind

play02:20

and a Butterworth filter has the

play02:23

characteristic that this graph is almost

play02:26

flat in this region and it falls off at

play02:29

the rate of 20 decibels per decade after

play02:33

the cutoff frequency which is being

play02:35

shown by the screen line right here and

play02:38

another thing to note is that at the

play02:40

growl frequency the gain is about minus

play02:43

3 decibels and we arrive at this result

play02:46

quite erratically so you can have a

play02:48

slight error when you perform this

play02:51

experiment and since this is only a

play02:54

practical demonstration so I will not be

play02:56

going into any theory of the the this

play02:59

graph or the low-pass filter however I

play03:02

would recommend that you check out my

play03:04

another tutorial on the active low pass

play03:06

filter in which I explain how we arrive

play03:10

at the formula for the cutoff frequency

play03:11

and I also explain this graph right here

play03:14

but if you only want the practical

play03:16

demonstration then you can continue

play03:18

watching this video and this is my

play03:21

experimental setup for this circuit and

play03:24

my power supply for the operation

play03:26

amplifier let me just pull this frame

play03:28

right here so that we can compare it

play03:30

with the circuit diagram so this wire

play03:33

right here is my input signal then this

play03:36

resistance is r1 resistance which is

play03:39

going into the second terminal after or

play03:42

the second pin or two seven four once

play03:44

the operational amplifier and as you can

play03:46

see it with the circuit diagram there is

play03:49

another resistance r2 popping over

play03:51

towards our sixth pin of two seven four

play03:53

one CIC and another capacitance that is

play03:58

C as compared to the circuit diagram

play04:01

which is going from the second terminal

play04:03

or the second pin of the CERN for one C

play04:06

is e to the sixth pin of the operational

play04:09

amplifier since the sixth pin is for the

play04:12

output and then there is another yellow

play04:15

wire in this sixth then connected to the

play04:18

six pin of the operational amplifier on

play04:20

to the output of the operational

play04:21

amplifier which will be would be of

play04:25

observing on the DSO that is the digital

play04:28

storage oscilloscope let me just get

play04:31

them zoom in into towards the pins so

play04:37

that you can see them even more clearly

play04:40

okay so that's better and also note that

play04:44

the seventh pin of this operational

play04:46

amplifier is connected to the positive

play04:47

terminal of the battery that is to our

play04:51

to the 50 plus 15 volts and the fourth

play04:54

terminal the yellow wire right here is

play04:56

going towards the negative terminal of

play05:00

the power supply

play05:03

now I'm giving a 20 Hertz input signal

play05:06

to this active low-pass filter and I'm

play05:09

observing the output on the DSL let me

play05:13

just hold this frame right here for a

play05:16

moment now as you can see that the

play05:19

yellow curve is for the input signal and

play05:22

the blue curve is the output signal that

play05:25

I'm getting from the active low-pass

play05:28

filter now as you can see since we used

play05:31

the operational amplifier in an

play05:34

inverting configuration therefore both

play05:36

the signals are out of phase now that we

play05:39

can see that our low-pass filter is

play05:41

working what we are going to do is we

play05:43

are going to observe the output signal

play05:45

for a variety of frequencies and then we

play05:48

are going to plot the gain versus

play05:50

frequency graph so I just set the

play05:53

frequency generator at a particular

play05:55

frequency let's say I said it at

play05:58

approximately 40 Earth's 41 Hertz or 42

play06:02

Hertz

play06:03

and then go over to your DSO and observe

play06:07

the input as well as output signal now I

play06:11

have already measured my input signal to

play06:13

be at around three point five two bowls

play06:16

so what I'm going to do is I'm just

play06:18

going to measure the the amplitude of my

play06:21

output signal

play06:27

okay so just turn on the cursor mode of

play06:31

my DSO ad measure the amplitude of the

play06:38

output signal and I'm getting somewhat

play06:41

three point six zero volts as the output

play06:46

voltage at 42 Hertz as can be seen from

play06:50

the DSO so just no doubt that reading on

play06:54

your observation file and change the

play06:58

frequency again and note down that

play07:02

reading too now I'm sorry I forgot to

play07:06

tell you the values of the resistances

play07:09

and the capacitances that I use in the

play07:11

circuit before so let me just tell you

play07:13

that the r2 resistance that I'm using is

play07:17

of one pillow and the capacitance is of

play07:21

point zero 1 micro farad and if you

play07:23

calculate the cutoff frequency using the

play07:26

former that I showed you before that was

play07:27

one by two PI R 2 C then you get the

play07:30

real frequency at about fifteen thousand

play07:34

923 Hertz that is approximately sixteen

play07:38

clothes so theoretically or as we will

play07:42

also experiment leave my output voltage

play07:46

will remain about somewhere between

play07:49

three point five to three point 6 volts

play07:53

up till I reach the cutoff frequency

play07:56

since the input voltage that is a yellow

play07:59

go right there is of three point six

play08:01

zero volts or somewhere near that so the

play08:07

cutoff frequency

play08:08

I'm sorry so that output voltage will

play08:12

also be somewhat and somewhere near that

play08:16

up till I reach the critical frequency

play08:19

and as you can see I am getting the same

play08:22

voltage again and again now let's see

play08:24

what we get at the cutoff frequency that

play08:26

is 16 kilo Hertz as you can see I have

play08:29

given 16 kilo Hertz input signal and I

play08:32

am getting approximately two point six

play08:34

two volts which is almost correct as at

play08:37

the cutoff frequency I should be getting

play08:40

70 point seven percent of the input

play08:42

voltage and since the input voltage

play08:43

three point 6 volts its 70.7% comes out

play08:47

and about something two point five four

play08:49

volts now let's increase the frequency a

play08:52

little further and observe the output

play08:55

voltage and just turn on the measuring

play08:59

mode of your DSO I am just adjusting the

play09:04

curve a little bit okay so if you

play09:09

measure the output voltage now it would

play09:11

be about two point five six volts or

play09:17

five eight volts which is good and now I

play09:23

have increased input frequency to about

play09:25

twenty five kilo Hertz and the output

play09:27

voltage is now two point one four volts

play09:29

so just keep taking the readings of the

play09:33

output voltage at various frequencies at

play09:36

least I would say that you take at least

play09:38

twenty five readings with below the

play09:40

cutoff or the critical frequency and

play09:43

then another twenty five readings above

play09:45

the cutoff frequencies so that you have

play09:48

approximately like at least fifty values

play09:51

to plot a good curve between the output

play09:53

voltage and the frequency or even you

play09:58

can plot a curve between the gain and

play10:01

frequencies so take a lot of readings

play10:06

and make sure that you and the output

play10:10

voltage at the cutoff frequency is at

play10:12

about 70 point seven percent of the

play10:14

input

play10:16

and this is the curve that I got when I

play10:19

plotted the gain in decibels on the

play10:23

y-axis and log of the frequency along

play10:27

the x-axis and as you can see I took a

play10:30

lot of readings that's why I have gotten

play10:32

a pretty smooth curve and it also

play10:34

matches the theoretical plot in a very

play10:37

good manner so that's how you perform

play10:40

this experiment if you have any

play10:42

questions or doubts don't forget to drop

play10:45

them in the comment section down below

play10:46

and I will definitely get back to you

play10:49

and that's it thanks for watching and

play10:52

have a great day head

Rate This

5.0 / 5 (0 votes)

相关标签
Active FilterLow-PassOperational AmplifierCircuit DesignSignal ProcessingElectronics TutorialButterworth FilterFrequency ResponseExperiment SetupDSP
您是否需要英文摘要?