Forecasting (11): Weighted moving average forecast
Summary
TLDRThis video explains the concept and calculation of a weighted moving average, emphasizing the use of different weights for recent and older data points. It covers how to apply these weights in Excel, perform the calculations, and optimize the model using Solver to minimize the Mean Absolute Percentage Error (MAPE). The video also demonstrates how to adjust the weights dynamically and test the model’s performance. The goal is to forecast more accurately by giving higher weight to the most recent data and fine-tuning the model for optimal results.
Takeaways
- 😀 The Weighted Moving Average (WMA) method applies weights to previous data points when calculating the average, unlike a simple moving average.
- 😀 In WMA, a weight is assigned to each data point, with the sum of all weights equaling 1 to ensure a balanced calculation.
- 😀 The formula for WMA involves multiplying each previous data point by its respective weight, with the number of periods determining how many data points are used.
- 😀 A constraint is placed on the weight values, such that they must add up to 1, ensuring that no one data point dominates the forecast.
- 😀 For a period of two, a higher weight (e.g., 0.8) can be given to the most recent data point, while a smaller weight (e.g., 0.2) is assigned to older data points.
- 😀 You can adjust the weights for different periods to change the forecast, and it's important to test these changes for their effect on prediction accuracy.
- 😀 The forecasted value for a future period can be calculated by replacing actual data with forecasted values, continuing the forecast chain.
- 😀 Once forecasted values are used in place of actual data, the WMA continues based on these forecasted values for subsequent periods.
- 😀 Optimization of WMA parameters, such as weights, can be performed using methods like minimizing the Mean Absolute Percentage Error (MAPE).
- 😀 Solver in Excel can be used to optimize the weight parameters for the best results, although certain conditions may cause linearity issues, prompting the use of nonlinear solvers.
Q & A
What is a weighted moving average (WMA)?
-A weighted moving average (WMA) is a forecasting method where past data points are assigned different weights, unlike a simple moving average where all data points are weighted equally. This method gives more importance to recent data and less to older data.
Why are weights used in a weighted moving average (WMA)?
-Weights are used in WMA to prioritize more recent data points, which are considered more relevant for forecasting future values. By assigning higher weights to recent data and lower weights to older data, the forecast becomes more responsive to the latest trends.
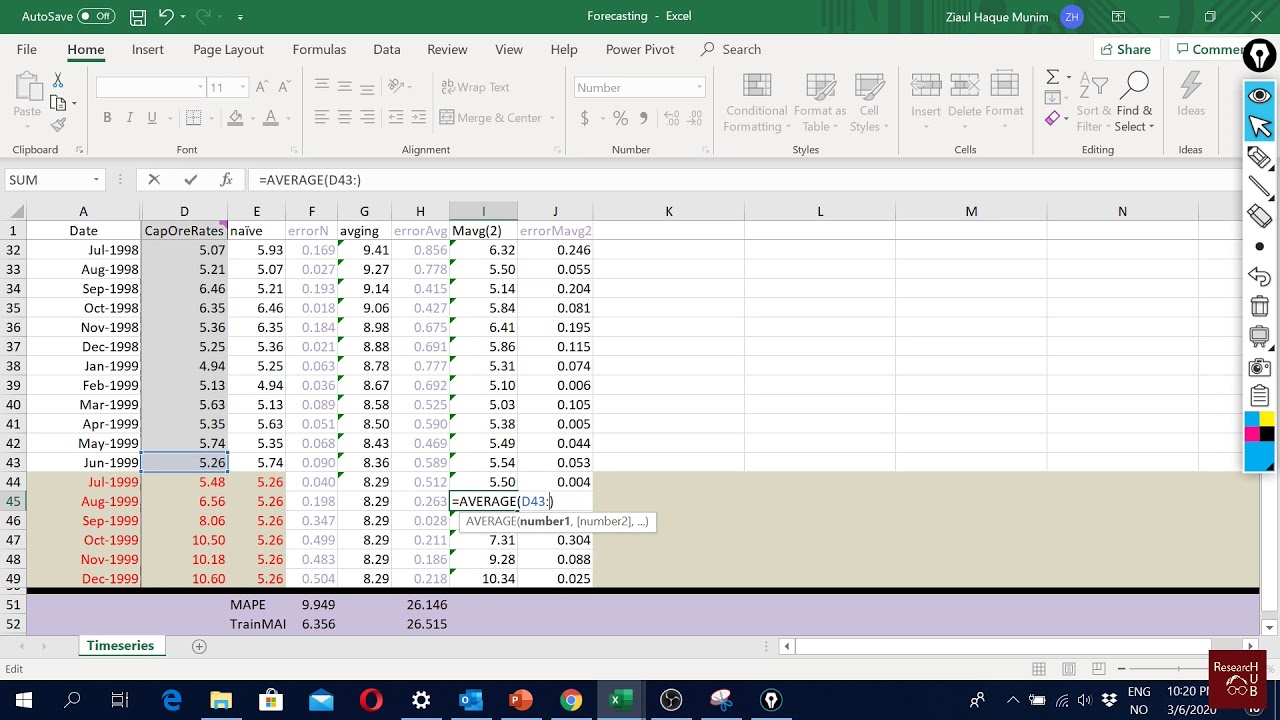
How do you calculate the weighted moving average in Excel?
-In Excel, the weighted moving average can be calculated using the `SUMPRODUCT()` function, which multiplies each data point by its respective weight and then sums the results. The formula is: `=SUMPRODUCT(data_range, weights_range)`, where the weights must sum to 1.
What is the role of the weights in a weighted moving average formula?
-In the WMA formula, the weights determine the relative importance of each data point. A higher weight for a recent data point means it has more influence on the forecast, while a lower weight for older data means it contributes less.
How do you set the weights in a weighted moving average?
-Weights are typically set based on how much importance you want to assign to each period. For example, you could assign a weight of 0.8 to the most recent data and 0.2 to the older data. The sum of all weights must always be 1.
What is the significance of the constraint that weights must sum to 1?
-The constraint that the weights must sum to 1 ensures that the forecast is based on a balanced combination of past data points. It prevents the forecast from becoming disproportionately influenced by one data point, maintaining a fair representation of the historical data.
How can you forecast future values when you don't have data points for the upcoming periods?
-When future data points are unavailable, you can forecast future values by using previously forecasted values. For instance, you would use the forecasted value from the last period to calculate the next period's forecast.
What is Solver in Excel, and how does it help in optimizing weights for the weighted moving average?
-Solver in Excel is a tool that allows you to find the optimal solution for a given problem. In the context of WMA, Solver can be used to adjust the weights to minimize the Mean Absolute Percentage Error (MAPE), improving the accuracy of the forecast.
How do you add a constraint to Solver for the weighted moving average?
-To add a constraint in Solver, you would specify that the sum of the weights must always equal 1. This ensures that the total weight distribution is consistent with the forecast formula.
What happens if the Solver tool in Excel cannot find an optimal solution?
-If Solver cannot find an optimal solution, it may suggest reverting to a simpler model, such as the naive forecast, where all past data points are treated equally. This may occur if the constraints or model setup don't allow for significant improvement over the basic forecast.
Outlines

此内容仅限付费用户访问。 请升级后访问。
立即升级Mindmap

此内容仅限付费用户访问。 请升级后访问。
立即升级Keywords

此内容仅限付费用户访问。 请升级后访问。
立即升级Highlights

此内容仅限付费用户访问。 请升级后访问。
立即升级Transcripts

此内容仅限付费用户访问。 请升级后访问。
立即升级浏览更多相关视频

Peramalan Permintaan Part 1 (Moving Average and Weighted Moving Average)

Exponentially Weighted Moving Average or Exponential Weighted Average | Deep Learning
Forecasting (10): Moving average forecast

Weighted Moving Average Explained - Calculation, Formula and Tips for Traders
Intro to Z-scores

Stock Trading: Moving Averages
5.0 / 5 (0 votes)
