ICT Market Maker Models simplified in 9 Minutes
Summary
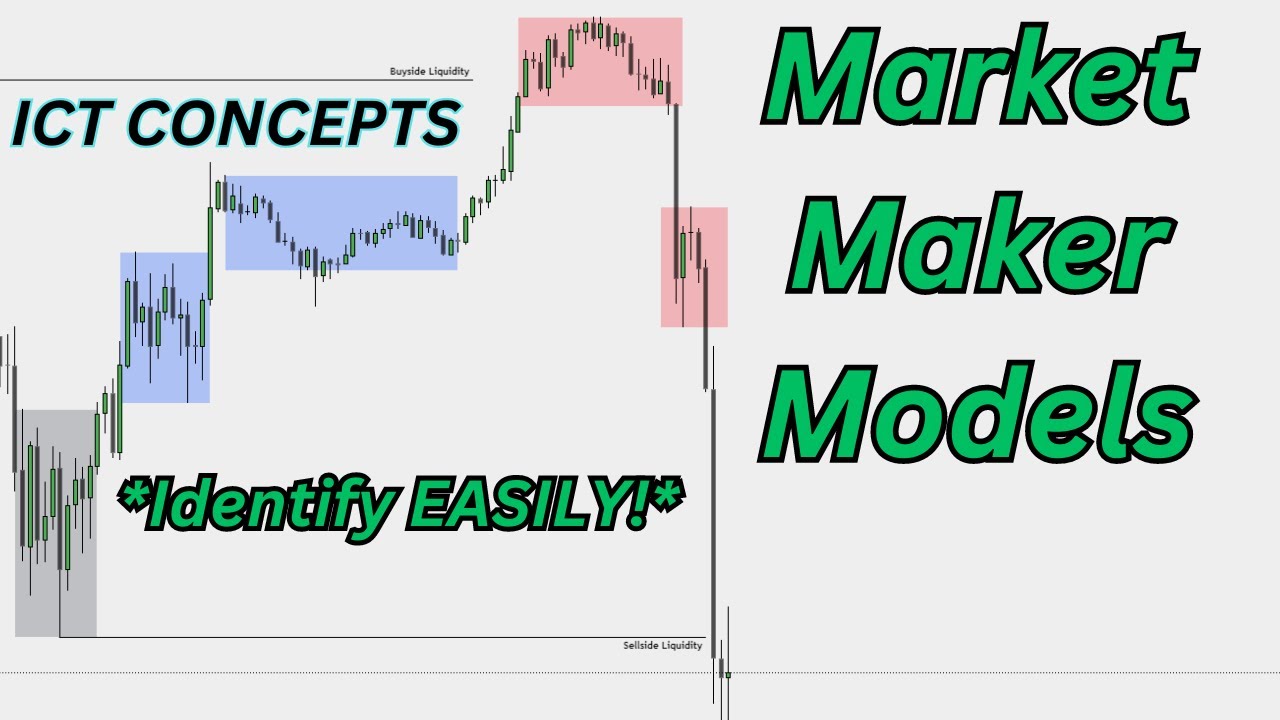
TLDRIn this video, the creator explains the concepts of market maker models, focusing on the difference between the market maker buy and sell models. Through clear examples, the script explains how the market moves in trends, including concepts like equal highs, liquidity zones, and market structure shifts. The video emphasizes the importance of identifying fair value gaps and using them to profit from market trends. The approach works across all timeframes, and viewers are encouraged to practice by identifying both bullish and bearish setups to become profitable in trading.
Takeaways
- 😀 The video introduces the concept of Market Maker Models, with a focus on understanding market structure and order flow.
- 😀 Equal highs represent key points in the chart, marking potential liquidity areas.
- 😀 Below the equal highs, there is sell-side liquidity that can be identified as key market levels to monitor.
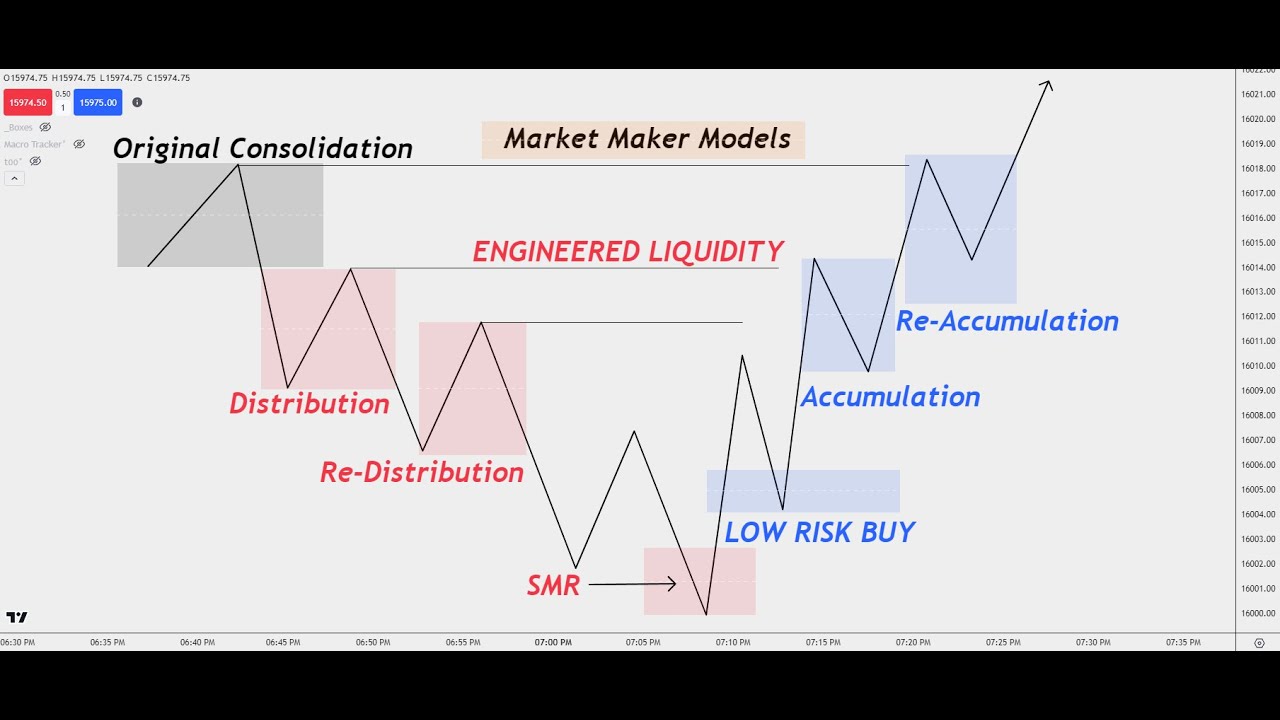
- 😀 Market structure shifts when an upward movement occurs, breaking previous lows and signaling a trend change.
- 😀 The shift from a downtrend (Market Maker Sell Model) to an uptrend (Market Maker Buy Model) indicates a major market structure change.
- 😀 A Market Maker Buy Model consists of higher highs, higher lows, and consistent upward movement.
- 😀 To profit from these models, traders can look to buy in fair value gaps, targeting highs while setting stop losses below the lows.
- 😀 The principles of Market Maker Models work across all timeframes, from minute charts to daily charts.
- 😀 The models are consistent—if the market is moving down, it's in a sell model; if it's moving up, it's in a buy model.
- 😀 The ultimate goal is to identify repeated market movements—bullish or bearish—and trade based on these predictable patterns.
Q & A
What is the primary focus of the video?
-The video focuses on explaining Market Maker Models, particularly how they relate to order flow and market structure shifts. It aims to help viewers understand the key concepts behind these models for trading.
What are equal highs and why are they important in the Market Maker Model?
-Equal highs are levels on a chart where the price has reached the same high multiple times. They are important because they represent areas of liquidity, which market makers often target to trigger price moves, especially during the reversal phases.
What is meant by sell-side liquidity, and how does it impact the market?
-Sell-side liquidity refers to the demand for selling orders that are positioned below market lows. This liquidity can be 'taken out' by the market, causing a price movement downwards, which is often part of the Market Maker Sale Model.
How does the Market Maker Sale Model differ from the Market Maker Buy Model?
-The Market Maker Sale Model is characterized by a downtrend with lower highs and lower lows. The Market Maker Buy Model, on the other hand, is a reversal where the market shifts to an uptrend with higher highs and higher lows.
What is a Market Structure Shift, and why is it important in trading?
-A Market Structure Shift occurs when the market changes direction, typically from a downtrend to an uptrend, or vice versa. It’s crucial because it signals a potential reversal, which traders can use to enter trades in the new trend direction.
How can traders use the Fair Value Gap to identify potential trades?
-The Fair Value Gap is a region where price has moved quickly, leaving a gap between levels of support or resistance. Traders can enter trades when the price retraces into this gap, aiming to target the highs while setting a stop loss below the low.
What does the term 'Market Maker Buy Model curve' refer to?
-The Market Maker Buy Model curve refers to the upward movement of the market after a structure shift, where the market begins to form higher highs and higher lows, indicating a bullish trend.
How does the Market Maker Model apply to different timeframes?
-The Market Maker Model can be applied across various timeframes, from short-term charts like the one-minute chart to long-term charts like the daily chart. The core concepts of market structure shifts and liquidity grabs are universal.
What should traders look for when identifying a trade on a one-minute chart?
-On a one-minute chart, traders should look for liquidity grabs, market structure shifts, and fair value gaps. Once identified, they can enter trades by setting stop losses below recent lows and targeting the highs for potential profits.
What is the key takeaway for becoming profitable with Market Maker Models?
-The key takeaway is to consistently recognize and apply the Market Maker Buy and Sell Models across different market conditions. By practicing and identifying 10 setups on both bullish and bearish sides, traders can improve their profitability.
Outlines

此内容仅限付费用户访问。 请升级后访问。
立即升级Mindmap

此内容仅限付费用户访问。 请升级后访问。
立即升级Keywords

此内容仅限付费用户访问。 请升级后访问。
立即升级Highlights

此内容仅限付费用户访问。 请升级后访问。
立即升级Transcripts

此内容仅限付费用户访问。 请升级后访问。
立即升级浏览更多相关视频
Episode 8: Finding Market Makers Models (MMXM's) - ICT Concepts

EXPOSED - ICT’s Favorite Trading Strategy (Hear it From ICT Himself)
ICT Concepts: Understanding How To Trade ICT Market Maker Models!

The only ICT MMXM video you'll ever need

Market Maker Models (COMPLETE GUIDE) - Ep. 10

Market Maker Models Explained | Step By Step Approach | ICT Concepts
5.0 / 5 (0 votes)
