Teori Regresi Linier Sederhana (Part 1) - Statistika Parametrik
Summary
TLDRThis video explains the concept of simple linear regression analysis, focusing on the difference between correlation and regression. It traces the history of regression, starting with Sir Francis Galton's research on the height of parents and children, which led to the concept of regression towards the mean. The script also covers key terminology, such as independent and dependent variables, and the regression model formula. A practical example demonstrates how advertising impacts sales in a company, with an explanation of hypothesis testing and statistical methods used in regression analysis.
Takeaways
- 😀 Regression analysis forms a straight line, whereas correlation does not require data to be on a straight line.
- 😀 Simple linear regression analysis predicts a dependent variable based on an independent variable using past data.
- 😀 The term 'regression' originates from Sir Francis Galton’s research on the height of parents and their children in 1877.
- 😀 Regression involves a relationship between dependent and independent variables, while correlation simply shows the relationship without implying causality.
- 😀 A key feature of regression is that predictions must lie exactly on a straight line, unlike correlation.
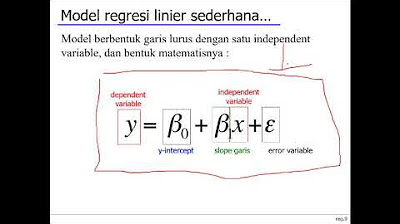
- 😀 Simple regression models involve a single independent variable (X) and a dependent variable (Y), while multiple regression involves more than one independent variable.
- 😀 The constant term (Beta0) in a regression model defines where the line starts, and the slope (Beta1) indicates the rate of change in Y as X increases.
- 😀 The residual value (epsilon) in regression quantifies the difference between predicted and observed values, helping evaluate the accuracy of predictions.
- 😀 The formula for the regression coefficient involves summing specific values like Sigma(X), Sigma(Y), and Sigma(X^2).
- 😀 Examples of independent and dependent variables include relationships like parents' height affecting children's height, or advertising costs influencing company sales.
- 😀 A real-life example of simple linear regression is used to analyze the relationship between advertising and sales in a company, aiming to predict sales targets based on advertising efforts.
Q & A
What is the main difference between correlation and regression?
-The main difference is that correlation shows the relationship or contribution between two variables without indicating cause or effect, while regression focuses on predicting values and establishing a cause-effect relationship between the independent and dependent variables.
Who is credited with the discovery of regression, and what was the main focus of their research?
-Sir Francis Galton is credited with the discovery of regression. His research focused on the relationship between the height of parents and their children, where he observed that the children's heights tended to regress towards the mean, rather than strictly follow the parent's height.
What does the term 'regression' mean in statistical analysis?
-In statistical analysis, regression refers to the study of dependence between variables, where one variable (the dependent) is predicted based on one or more independent variables, typically using a functional relationship.
Why does regression always result in a straight line?
-Regression always results in a straight line because it involves modeling a linear relationship between the dependent and independent variables, where the predicted values fall directly on that line.
What does the 'epsilon' (ε) term represent in a regression equation?
-In a regression equation, epsilon (ε) represents the residuals or errors, which are the differences between the observed data points and the predicted values. It indicates how far off the predictions are from the actual values.
What is the significance of the constant term (β0) in a regression equation?
-The constant term (β0) in a regression equation represents the intercept, or the value of the dependent variable when the independent variable (X) is zero. It helps in defining the starting point of the regression line.
How does the regression coefficient (β1) influence the regression line?
-The regression coefficient (β1) determines the slope of the regression line. It indicates how much the dependent variable (Y) changes for a one-unit increase in the independent variable (X).
What is the formula for simple linear regression?
-The formula for simple linear regression is Yi = β0 + β1Xi + εi, where Yi is the predicted value of the dependent variable, β0 is the constant, β1 is the regression coefficient, Xi is the independent variable, and εi is the error term.
What is the difference between simple and multiple regression?
-Simple regression involves one independent variable to predict the dependent variable, while multiple regression involves two or more independent variables to predict the dependent variable.
How do you perform a hypothesis test in regression analysis?
-In regression analysis, a hypothesis test typically involves testing the significance of the regression coefficient (β1). The null hypothesis (H0) states that the coefficient is zero, while the alternative hypothesis (H1) suggests that it is positive. A t-test is used to determine whether the regression coefficient significantly differs from zero.
Outlines

此内容仅限付费用户访问。 请升级后访问。
立即升级Mindmap

此内容仅限付费用户访问。 请升级后访问。
立即升级Keywords

此内容仅限付费用户访问。 请升级后访问。
立即升级Highlights

此内容仅限付费用户访问。 请升级后访问。
立即升级Transcripts

此内容仅限付费用户访问。 请升级后访问。
立即升级浏览更多相关视频
Data Mining 09 - Korelasi & Analisa Regresi (1/2)

(1/4) Analisis Regresi : Uji asumsi Klasik
Tutorial Analisis Regresi Tunggal dengan JASP

Cara Menghitung Analisis Regresi Sederhana secara Manual
Week 6 Statistika Industri II - Analisis Regresi (part 1)

Statistik Teori pertemuan ke ~ 9 Korelasi dan Regresi
5.0 / 5 (0 votes)
