SSR2093 Lab Practical: Task 1
Summary
TLDRThe transcript details a technical process focused on using software and tools for remote sensing and data analysis. The speaker discusses various steps such as working with satellite image data, applying image processing techniques, and using tools like Processing for data visualization. They explore the importance of correct data handling, layering, and utilizing infrared and thermal bands. The discussion also includes aspects of using photogrammetry, analyzing environmental data, and preparing for predictive modeling. The overall focus is on manipulating and processing geospatial data to extract useful insights, with a practical approach to software usage in a research or project context.
Takeaways
- 😀 The script focuses on using software to process and analyze data, specifically mentioning tools like Shimeji 2012 and remote sensing data processing.
- 😀 It emphasizes the importance of data cleaning and organizing data types to ensure the processing pipeline runs smoothly.
- 😀 A key point is the utilization of infrared and thermal bands in remote sensing to capture different environmental factors like plant health and water levels.
- 😀 The speaker discusses various data bands, including blue, green, and infrared bands, explaining their relevance to understanding different aspects of the environment.
- 😀 The script highlights the need for careful data management, including working with files in formats like CSV and preprocessing data through raster-scan methods.
- 😀 The concept of photogrammetry is mentioned, emphasizing its role in data visualization and object recognition in fields like architecture and environmental analysis.
- 😀 There is mention of a step-by-step data processing workflow involving tasks like reducing data, applying transformations, and validating results using models.
- 😀 The use of metadata for data analysis is underlined, showing how it can assist in predictions and understanding data layers.
- 😀 A portion of the script talks about challenges faced with data quality, like issues with sensors or image clarity, and how those issues were overcome.
- 😀 The process of combining different data layers, including geospatial data and metadata, to create a more comprehensive analysis is a central theme of the script.
Q & A
What is the primary software used in the script for processing data?
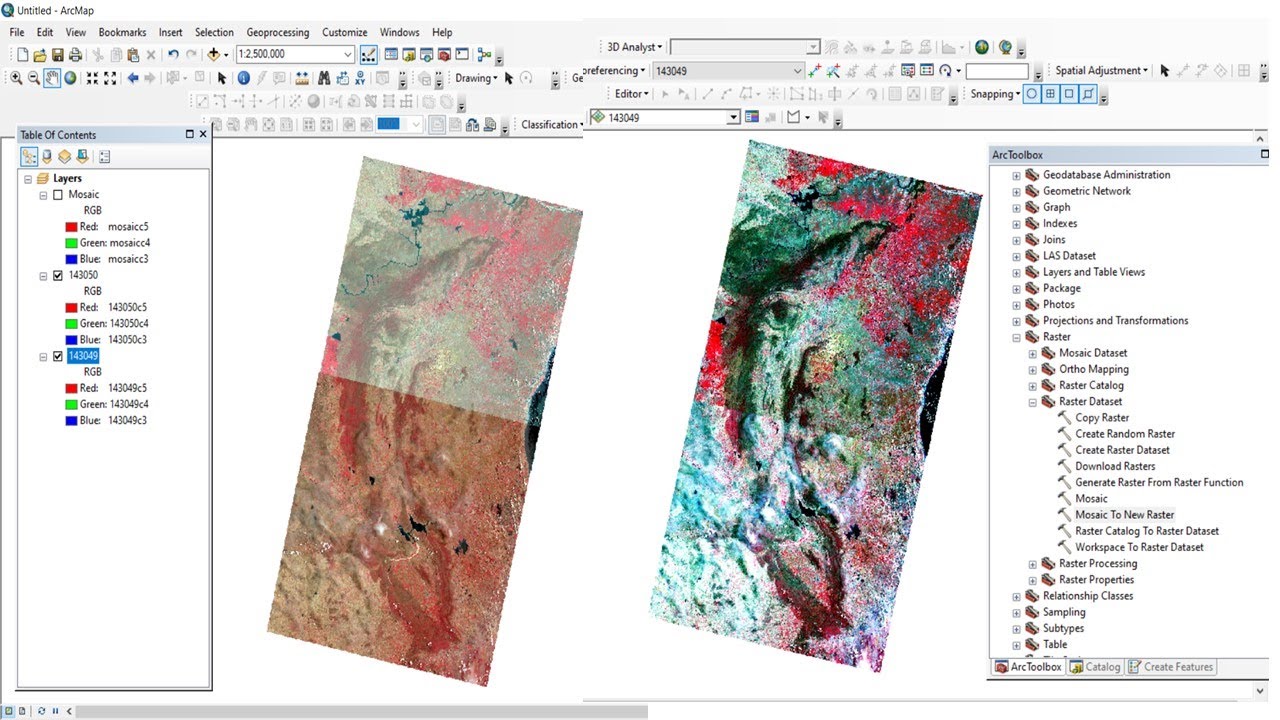
-The primary software mentioned for processing data is likely related to geographic or spatial data processing, using tools like 'Processing' for handling various data types, including images and geographic data.
What type of data is being used for analysis in the script?
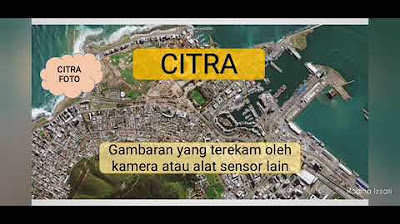
-The data being used includes geographic and remote sensing data, such as satellite imagery, thermal bands, and infrared data, which are processed to analyze various environmental aspects.
What is the significance of the various bands (Band 1, Band 2, Band 3, etc.) mentioned?
-Each band corresponds to a specific wavelength range, with Band 1 used for blue, Band 2 for green, Band 3 for red, and Band 4 for infrared, which are essential in remote sensing for analyzing vegetation, water, and other features on Earth.
What role does photogrammetry play in the script?
-Photogrammetry is used for creating 3D models and understanding spatial data, often combining camera images and geospatial data to improve the accuracy of environmental and geographical analysis.
Why is there a mention of using infrared and thermal bands in the script?
-Infrared and thermal bands are used to analyze heat signatures, water bodies, and vegetation health, as they provide crucial information about temperature variations and environmental conditions.
What are some challenges mentioned related to the data analysis process?
-Challenges include issues like data registration, sensor problems, and difficulties in handling certain types of images or data due to their complexity or poor quality.
What does the script suggest about the use of geospatial data for environmental monitoring?
-The script emphasizes using geospatial and remote sensing data for monitoring environmental changes, including vegetation, water bodies, and heat, which can be applied for research and analysis in environmental science and urban planning.
How does the script describe the data processing flow?
-The data processing flow involves importing raw data, processing it through various software tools, selecting appropriate bands, and analyzing them for patterns, such as vegetation health, water availability, and temperature variations.
What is the purpose of reducing data by 'ground impulse' mentioned in the script?
-Reducing data by 'ground impulse' refers to the process of filtering or refining the data to eliminate noise and improve the quality of the results, ensuring more accurate analysis of geographic features.
What role does metadata play in the data analysis process described in the script?
-Metadata provides essential information about the data, such as its source, format, and processing steps, which is necessary for understanding how the data was collected and processed, and for ensuring its proper use in analysis.
Outlines

此内容仅限付费用户访问。 请升级后访问。
立即升级Mindmap

此内容仅限付费用户访问。 请升级后访问。
立即升级Keywords

此内容仅限付费用户访问。 请升级后访问。
立即升级Highlights

此内容仅限付费用户访问。 请升级后访问。
立即升级Transcripts

此内容仅限付费用户访问。 请升级后访问。
立即升级浏览更多相关视频


5.0 / 5 (0 votes)
