4.4 Day 1 - Graphing Parabolas in Vertex Form (Part 1)
Summary
TLDRIn this tutorial, the focus is on graphing parabolas in vertex form. The video explains how the equation y = a(x - h)^2 + k represents a parabola, with a causing vertical stretch/compression, h shifting it horizontally, and k vertically. The process includes identifying transformations compared to y = x^2, determining the vertex and axis of symmetry, and using a table of values to sketch the graph. The video emphasizes the domain (all real numbers) and the range (y ≥ -3). The tutorial is packed with visual explanations, helping students grasp key concepts about parabolic graphs.
Takeaways
- 😀 The vertex form of a parabola is written as y = a(x - h)^2 + k.
- 😀 Changing the value of 'a' vertically stretches or compresses the parabola, with a positive 'a' causing no reflection.
- 😀 The value of 'h' shifts the parabola horizontally, moving it left or right.
- 😀 The value of 'k' shifts the parabola vertically, moving it up or down.
- 😀 When graphing a parabola, the first step is to describe the transformations compared to the standard y = x^2 graph.
- 😀 The vertex of a parabola in vertex form is located at (h, k).
- 😀 The axis of symmetry of the parabola is a vertical line given by x = h.
- 😀 To accurately graph the parabola, use a table of values with x-values around the vertex and plot the corresponding y-values.
- 😀 Parabolas are symmetrical around their axis of symmetry, so points on one side of the vertex mirror those on the other side.
- 😀 The domain of any parabola in vertex form is all real numbers, but the range depends on the vertex's position and the direction the parabola opens.
Q & A
What is the vertex form of a parabola?
-The vertex form of a parabola is written as y = a(x - h)² + k, where (h, k) is the vertex of the parabola, a determines the vertical stretch or compression, and the sign of a indicates whether the parabola opens upward or downward.
What effect does changing the value of 'a' have on the graph of a parabola?
-Changing the value of 'a' affects the vertical stretch or compression of the parabola. If |a| > 1, the parabola is vertically stretched, and if 0 < |a| < 1, the parabola is vertically compressed.
How does the value of 'h' transform the parabola?
-The value of 'h' shifts the parabola horizontally. If h is positive, the graph shifts to the right, and if h is negative, it shifts to the left.
What does the value of 'k' do to the parabola?
-The value of 'k' shifts the parabola vertically. If k is positive, the graph shifts upward, and if k is negative, the graph shifts downward.
In the example y = 2(x - 4)² - 3, what is the vertex of the parabola?
-The vertex of the parabola is at the point (4, -3). This is found by identifying the values of h and k in the vertex form of the equation.
What is the axis of symmetry for the parabola y = 2(x - 4)² - 3?
-The axis of symmetry is the vertical line x = 4, which is the x-coordinate of the vertex.
How is the symmetry of a parabola helpful when graphing it?
-The symmetry of a parabola means that for every point on one side of the axis of symmetry, there is a corresponding point on the other side. This makes it easier to plot points and accurately graph the parabola.
What is the domain of the parabola y = 2(x - 4)² - 3?
-The domain of the parabola is all real numbers (x can take any real value), as the parabola continues indefinitely along the x-axis.
What is the range of the parabola y = 2(x - 4)² - 3?
-The range of the parabola is y ≥ -3. Since the vertex represents the minimum point, the parabola will never go below y = -3.
Why is it important to choose x-values on either side of the vertex when graphing a parabola?
-Choosing x-values on either side of the vertex ensures that you capture the symmetry of the parabola, which allows for accurate plotting of points and sketching of the curve.
Outlines

此内容仅限付费用户访问。 请升级后访问。
立即升级Mindmap

此内容仅限付费用户访问。 请升级后访问。
立即升级Keywords

此内容仅限付费用户访问。 请升级后访问。
立即升级Highlights

此内容仅限付费用户访问。 请升级后访问。
立即升级Transcripts

此内容仅限付费用户访问。 请升级后访问。
立即升级浏览更多相关视频
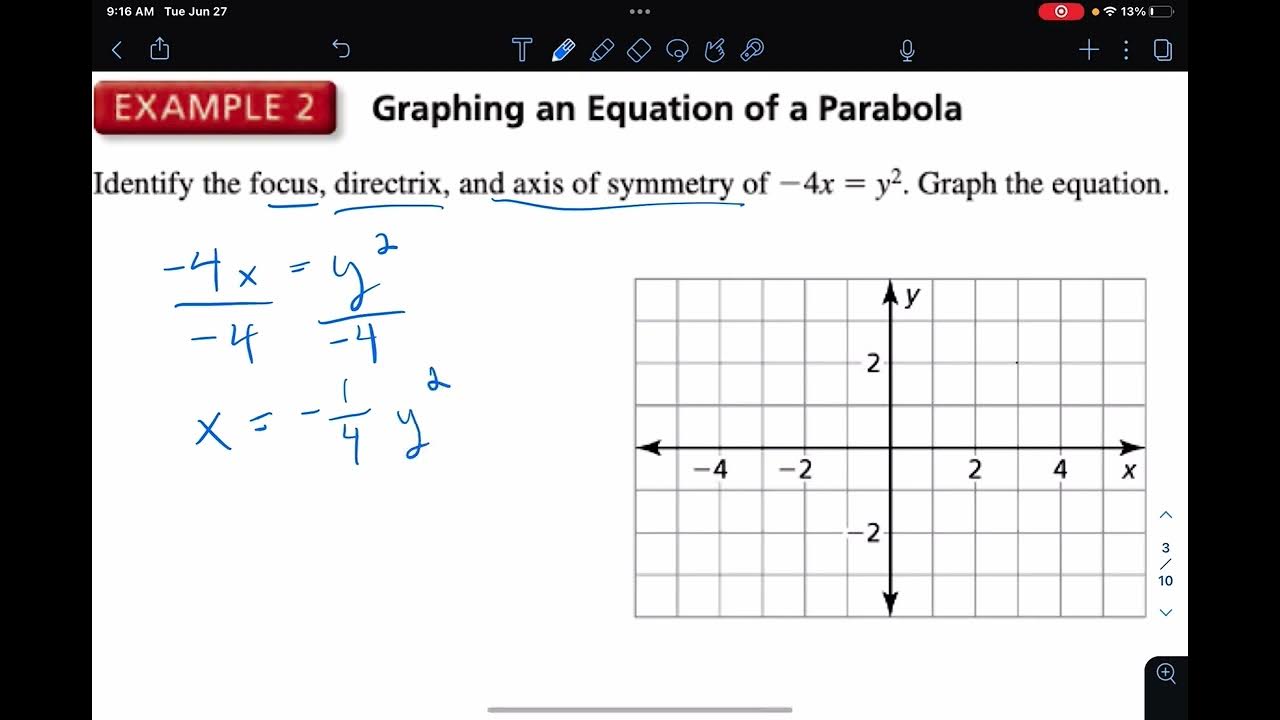
A2 Focus and Directrix
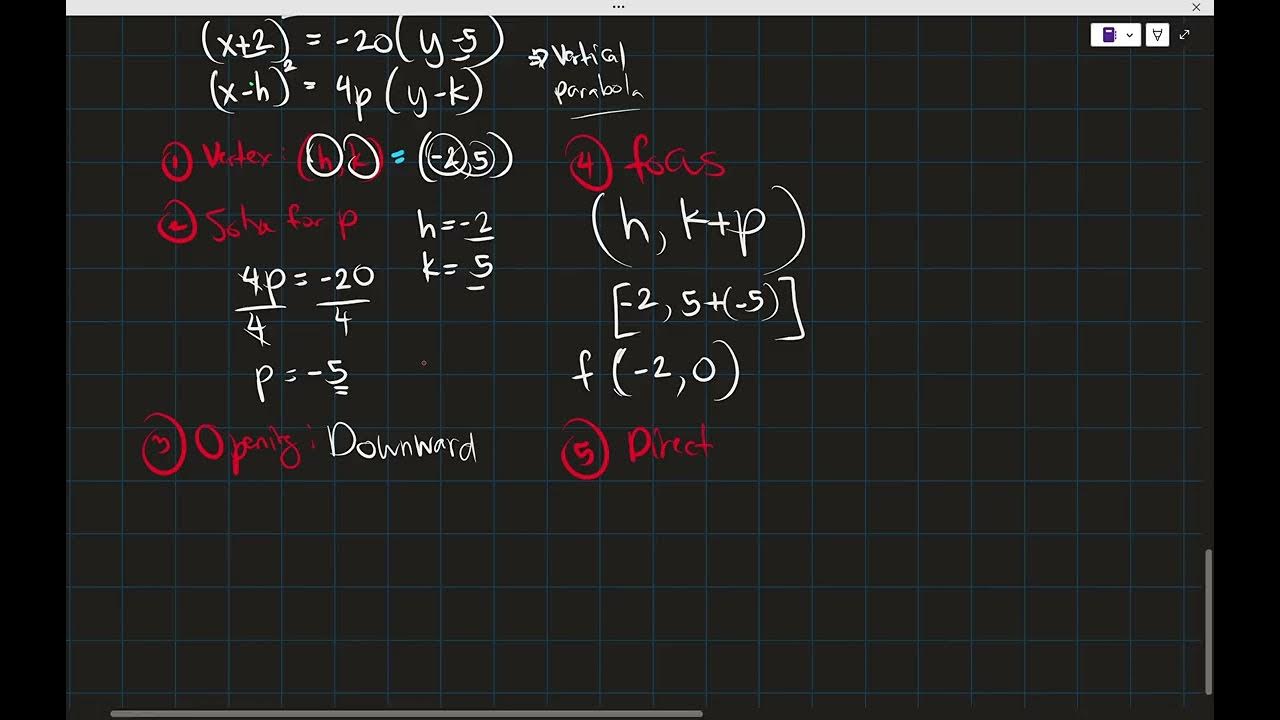
Review on Parabola
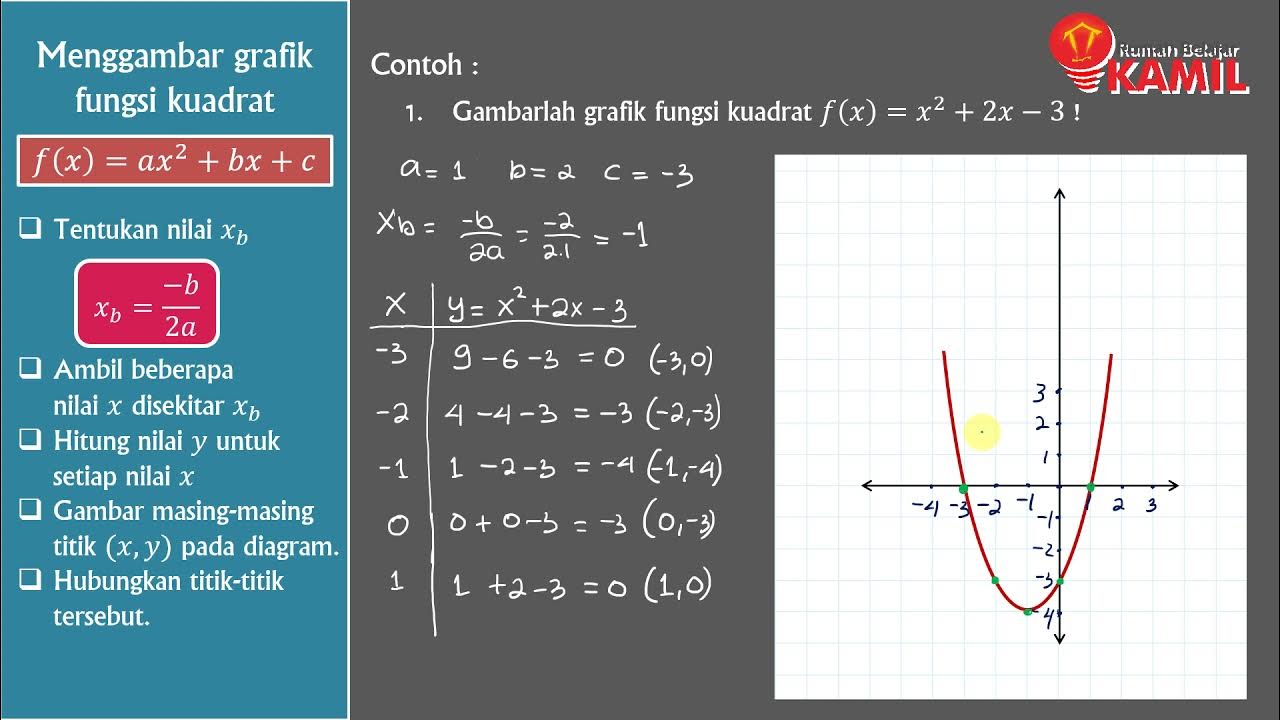
Matematika Kelas 9 : Fungsi Kuadrat (Part 3 : Menggambar grafik fungsi kuadrat)
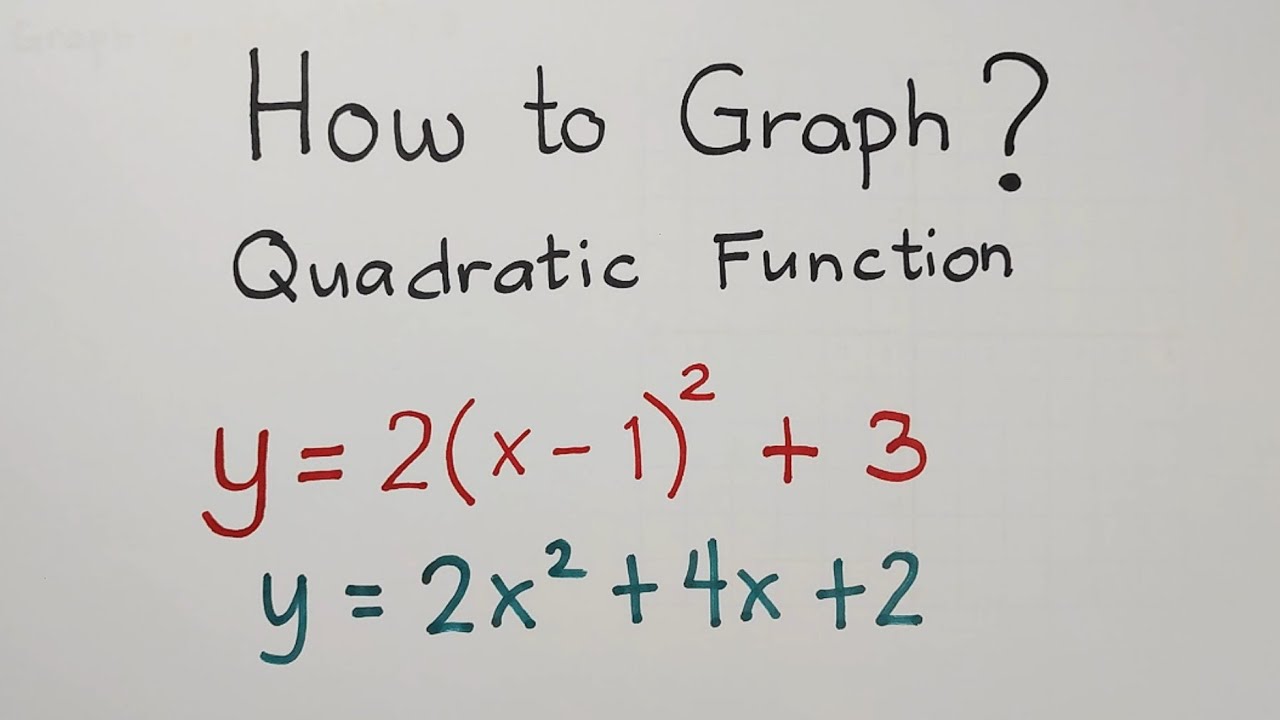
How to Graph a Quadratic Function? Quadratic Function, Vertex, Axis of Symmetry and Parabola

Draw Parabola Grade 11 | Part 1 | Grade 11 Functions
Grade 9 Math Q1 Ep14: Graphing a Quadratic Function
5.0 / 5 (0 votes)
