5 ILMU UKUR TANAH POTONGAN MEMANJANG DAN MELINTANG
Summary
TLDRThis instructional video guides viewers through the process of plotting elevation points on a map using measured data. It explains how to determine the proper scales for both horizontal and vertical distances, with examples of applying a 1:1000 horizontal scale and a 1:100 vertical scale. The instructor demonstrates how to plot the points, connect them to form terrain lines, and visualize elevation changes. The lesson emphasizes careful plotting and scale usage, with the promise of further lessons on creating cross-sectional views. It's an essential tutorial for students learning technical drawing and topographic map creation.
Takeaways
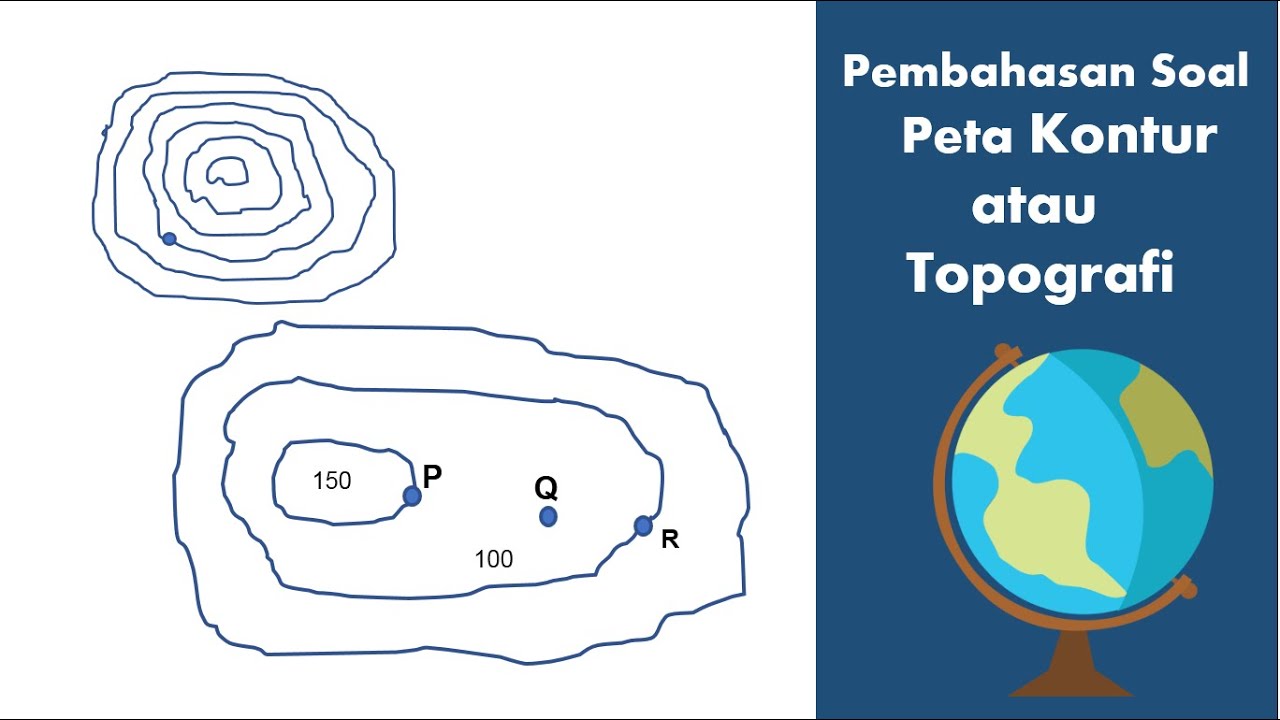
- 😀 The lesson focuses on plotting elevation data based on measured points from a survey.
- 😀 Horizontal scale is set to 1:1000, meaning each 50 meters on the ground is represented as 5 cm on paper.
- 😀 Vertical scale is set to 1:100, meaning each meter of elevation corresponds to 1 cm on paper.
- 😀 Measurements from the survey include specific elevation points ranging from 49.5m to 53.6m.
- 😀 The plotted points are spaced 50 meters apart horizontally, creating a continuous map of the terrain.
- 😀 The elevation data is visualized through a cross-sectional drawing, showing rises and falls in the terrain.
- 😀 After plotting the points on paper, they are connected to form the terrain's profile.
- 😀 The process of plotting elevation is not difficult if the scales and measurements are carefully followed.
- 😀 The next lesson will address plotting longitudinal sections with a similar method but with some differences.
- 😀 The lecturer encourages viewers to ask questions in the comments if any parts of the process are unclear.
Q & A
What is the primary focus of this lesson?
-The lesson focuses on plotting elevation data points on paper, creating a visual representation of terrain elevation by using appropriate scales for horizontal and vertical axes.
How are the data points arranged in the plot?
-The data points are arranged based on elevation measurements at various points labeled A, 1, 2, 3, and B, with corresponding values like 50, 53, 65, etc.
What scale is used for the horizontal axis in this lesson?
-For the horizontal axis, a scale of 1:1000 is used, meaning each 50 meters in real life is represented as 5 cm on paper.
What scale is used for the vertical axis in this lesson?
-For the vertical axis, a scale of 1:100 is used, meaning each 1 meter in elevation is represented as 1 cm on the paper.
Why is it important to choose the correct scale for the drawing?
-Choosing the correct scale ensures that the drawn elevation profile fits within the paper size, especially when using A4 paper, making it visually accurate and manageable.
What is the purpose of using dashed lines in the plotting process?
-Dashed lines are used to mark the elevation values at specific points without connecting them directly, helping to visualize where the elevation falls on the graph before finalizing the connections.
What happens when the elevation between two points increases or decreases?
-When the elevation increases between two points, the line on the graph moves upwards, indicating a rise in terrain. Conversely, when the elevation decreases, the line slopes downward.
How are the elevation values read from the graph?
-The elevation values are read by drawing lines from each point based on the measured elevations, and by visually determining where the lines intersect the appropriate scales for both horizontal and vertical axes.
What steps should be followed after plotting the points on the paper?
-After plotting the points, the next step is to connect them with lines, ensuring that the changes in terrain (rises and falls) are accurately represented, and then reviewing the plotted profile.
What is the key takeaway from this lesson regarding terrain mapping?
-The key takeaway is the process of accurately plotting elevation data on paper using proper scaling techniques, which enables the visualization of terrain features like slopes and changes in elevation over distance.
Outlines

此内容仅限付费用户访问。 请升级后访问。
立即升级Mindmap

此内容仅限付费用户访问。 请升级后访问。
立即升级Keywords

此内容仅限付费用户访问。 请升级后访问。
立即升级Highlights

此内容仅限付费用户访问。 请升级后访问。
立即升级Transcripts

此内容仅限付费用户访问。 请升级后访问。
立即升级


5.0 / 5 (0 votes)
