Contoh Soal dan Pembahasan Metode Kuadrat Terkecil - Matematika Wajib Kelas XI Kurikulum Merdeka
Summary
TLDRIn this video, the presenter explains how to determine the best-fit line for predicting humidity levels in Indonesian cities using the method of least squares regression. The example focuses on calculating the regression lines, comparing their accuracy, and applying them to predict humidity based on average daily temperatures. The video guides viewers through the process of substituting temperature values into the equations to predict humidity, and vice versa, demonstrating the power of regression analysis in real-world scenarios. Viewers will gain insights into solving similar problems and understanding the methodology behind it.
Takeaways
- 😀 The video explains linear regression and how to determine the best fit line using the least squares method.
- 😀 The example involves predicting the humidity in various Indonesian cities based on daily average temperatures for June 2023.
- 😀 Two regression lines are given, and the task is to determine which one is the best fit for the data provided.
- 😀 The video walks through the process of calculating and comparing the sum of squared residuals (Σ(y - ŷ)^2) for both regression lines.
- 😀 The first line, Ŷ = 109 - X, resulted in a lower sum of squared residuals, making it the better fit for predicting humidity.
- 😀 The process involves using the given daily temperature data (X) and humidity data (Y) to calculate predicted values (Ŷ) for both lines.
- 😀 The video shows how to calculate Ŷ values for both regression lines by substituting the given X values into the respective equations.
- 😀 After finding the residuals (Y - Ŷ), the squares of these residuals are calculated to determine the sum of squared residuals.
- 😀 The second line, Ŷ = 108 - X, results in a higher sum of squared residuals, indicating it is not the better fit compared to the first line.
- 😀 The video also answers related questions, such as predicting humidity based on a given temperature or calculating the temperature based on a known humidity value.
- 😀 Overall, the video demonstrates how to apply the least squares method to determine the best regression line and use it for predictions.
Q & A
What is the main topic discussed in the video?
-The video focuses on explaining linear regression, specifically how to determine the best fit line using the method of least squares, with an example involving temperature and humidity data from several cities in Indonesia.
What is the method of least squares used for in the video?
-The method of least squares is used to find the regression line (best fit line) that minimizes the sum of the squared differences between the observed values (actual data points) and the predicted values from the regression model.
What data is provided in the example for regression analysis?
-The data provided includes the average daily temperature and humidity levels of several cities in Indonesia during June 2023. Five cities are used as a sample, with both temperature and humidity data given.
How is the regression line used to predict humidity?
-The regression line (ŷ = 109 - x) is used to predict humidity by substituting the temperature (x) values into the equation. The resulting ŷ value represents the predicted humidity for a given temperature.
What are the two regression equations given in the video?
-The two regression equations provided in the video are: Ŷ1 = 109 - x and Ŷ2 = 108 - x.
How do you determine which regression line is the best fit?
-To determine the best fit line, you calculate the sum of squared differences (Σ(y - ŷ)²) for each regression line. The line with the smaller sum of squared differences is considered the better fit.
What was the result of comparing the two regression equations?
-After calculating the sum of squared differences for both equations, the regression line Ŷ1 = 109 - x was found to have a smaller sum (34) compared to Ŷ2 = 108 - x (43), making Ŷ1 the better fit for predicting humidity.
How do you predict humidity for a given temperature using the best-fit regression line?
-To predict humidity for a specific temperature, substitute the temperature value into the chosen regression equation (Ŷ1 = 109 - x) and calculate the predicted humidity (ŷ). For example, for a temperature of 33°C, the predicted humidity is 76%.
What do you do when the humidity value is known, and you need to find the corresponding temperature?
-When the humidity is known, you substitute the humidity value (ŷ) into the regression equation and solve for the temperature (x). For instance, if the predicted humidity is 74%, substitute ŷ = 74 into the equation Ŷ1 = 109 - x, and solve for x to find the corresponding temperature.
How does the choice of regression equation affect the predictions?
-The choice of regression equation affects the predictions because different regression lines may provide slightly different values for the predicted humidity or temperature. The best-fit line, determined through the method of least squares, provides the most accurate predictions.
Outlines

此内容仅限付费用户访问。 请升级后访问。
立即升级Mindmap

此内容仅限付费用户访问。 请升级后访问。
立即升级Keywords

此内容仅限付费用户访问。 请升级后访问。
立即升级Highlights

此内容仅限付费用户访问。 请升级后访问。
立即升级Transcripts

此内容仅限付费用户访问。 请升级后访问。
立即升级浏览更多相关视频
Metode Kuadrat Terkecil Hal 97-101 Bab 3 STATISTIK Kelas 11 SMA Kurikulum Merdeka

Why a "least squares regression line" is called that...
Regresion Lineal
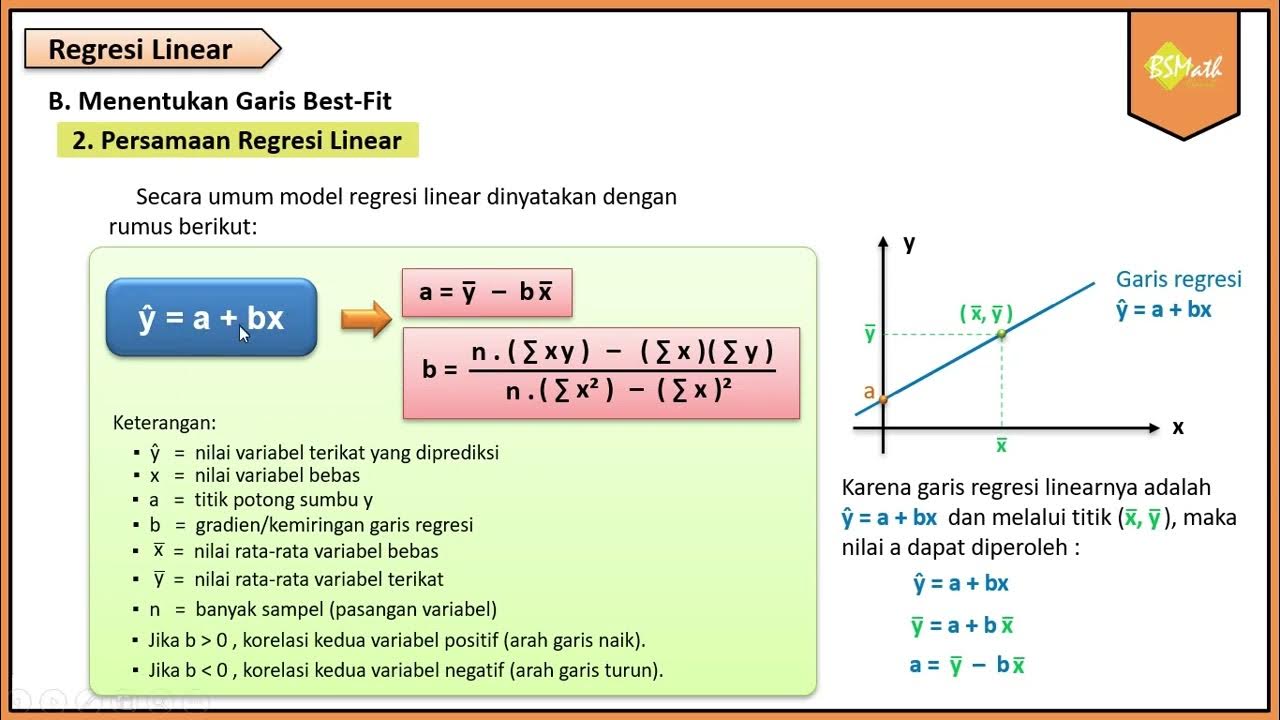
Persamaan Regresi Linear - Matematika Wajib SMA Kelas XI Kurikulum Merdeka
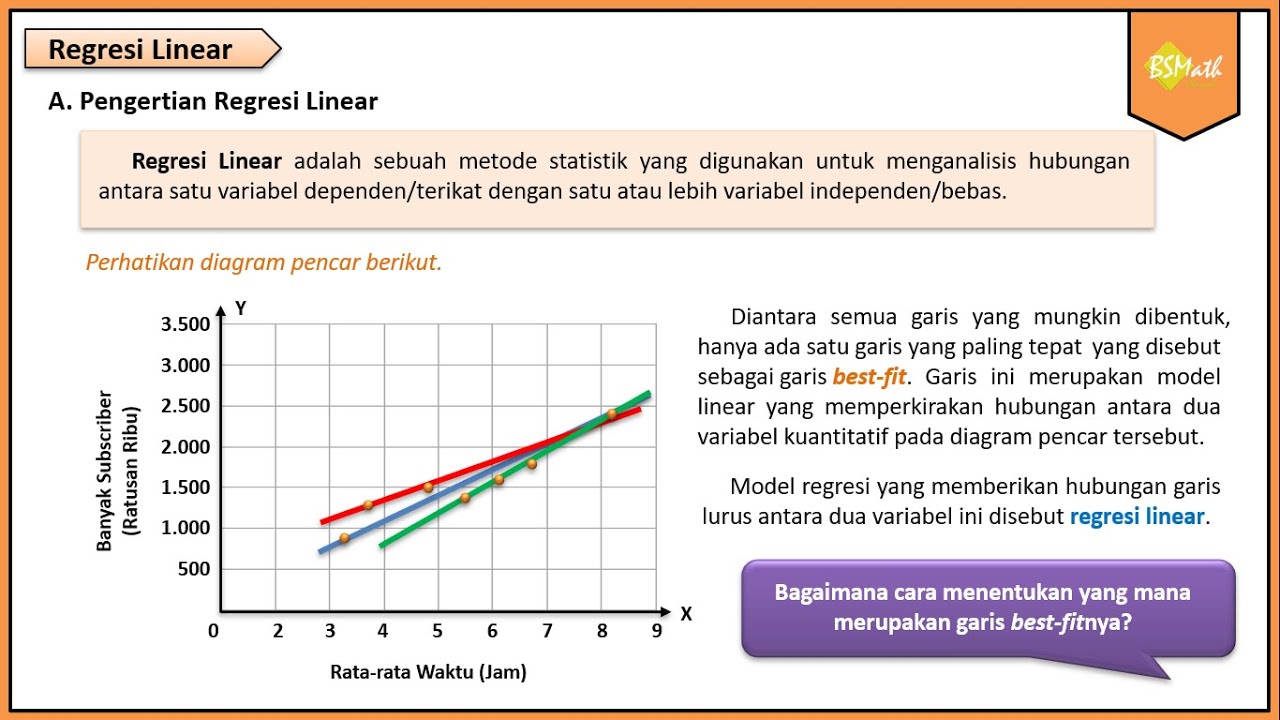
Pengertian Regresi Linear - Matematika Wajib Kelas XI Kurikulum Merdeka

La régression linéaire, quelques explications
5.0 / 5 (0 votes)
