Pengenalan SPSS bagi Pemula - Pertemuan 5
Summary
TLDRIn this tutorial, the presenter introduces the basics of using SPSS, a software tool for statistical data analysis. They guide the audience through setting up variables like names, education levels, and exam scores in SPSS, showing how to input data and set appropriate variable properties. The presenter explains how to perform simple statistical analyses, such as calculating the mean, median, and mode, as well as how to interpret the results. The video covers various SPSS functions, making it easy for beginners to learn how to work with statistical data and generate descriptive statistics.
Takeaways
- 😀 SPSS is a software used for statistical data processing, enabling users to perform data analysis and visualization.
- 😀 In SPSS, there are two main views: Data View and Variable View, which allow users to input and manage data variables.
- 😀 Data variables in SPSS can be configured with names, types, and formats, such as text (string) for names and numeric for scores.
- 😀 In the Variable View, you can define variables such as 'Name', 'Education Level', and 'Exam Score', adjusting properties like data type and value format.
- 😀 SPSS automatically assigns numeric codes for categorical data, like gender, where 1 represents male and 2 represents female.
- 😀 The software offers a variety of descriptive statistics tools, like mean, median, mode, standard deviation, and variance, for quick data analysis.
- 😀 SPSS allows for easy statistical analysis by checking the desired statistics, which are then automatically calculated and displayed.
- 😀 You can perform frequency analysis in SPSS to get insights into data distributions and calculate percentages, cumulative percentages, and more.
- 😀 The software provides several statistical tests such as one-sample t-test, paired sample t-test, ANOVA, regression analysis, and more.
- 😀 SPSS's ability to perform complex statistical tests and show detailed outputs saves time and avoids manual calculations, making it ideal for data-driven decision-making.
- 😀 As part of the learning process, SPSS introduces multiple statistical methods and offers practical tools for comparing and interpreting various data sets.
Q & A
What is the main purpose of using SPSS in the tutorial?
-The main purpose of using SPSS in the tutorial is to demonstrate how to process and analyze data using statistical tools within the software, focusing on variable setup, data entry, and descriptive statistics.
What is the first step after launching SPSS in the tutorial?
-After launching SPSS, the first step is to familiarize oneself with the interface, which includes the 'Data View' and 'Variable View' windows. These allow the user to input data and set up the variables.
What type of data is entered into the SPSS variables in the tutorial?
-In the tutorial, the data entered into SPSS includes 'Name', 'Education Level', and 'Exam Score', with names as string data, education as categorical data, and exam scores as numeric data.
Why is the underscore used instead of spaces in variable names in SPSS?
-The underscore is used in place of spaces in variable names because SPSS does not allow spaces in variable names. Using underscores helps maintain proper formatting and avoids errors.
How does SPSS handle categorical data like education level?
-SPSS handles categorical data, such as education level, by assigning it as a 'string' data type, where categories like 'SD', 'SMP', 'SMA', and 'University' are treated as text entries.
What is the significance of defining 'Value Labels' in SPSS, as seen in the tutorial?
-Defining 'Value Labels' in SPSS is important for associating numeric codes with specific categories, such as assigning '1' for male and '2' for female in the 'Gender' variable. This makes the data easier to interpret and analyze.
What statistical measures does SPSS provide for 'Exam Scores' in the tutorial?
-SPSS provides several statistical measures for the 'Exam Scores', including mean, median, mode, standard deviation, variance, minimum, and maximum. These help summarize the distribution of scores.
What is the advantage of using SPSS for descriptive statistics as shown in the tutorial?
-The advantage of using SPSS for descriptive statistics is its ability to instantly compute and display a variety of statistical measures, saving time and reducing the potential for human error compared to manual calculations.
What are the steps to perform a frequency analysis in SPSS according to the tutorial?
-To perform a frequency analysis in SPSS, you first select 'Descriptive Statistics', then choose 'Frequencies', and select the variables (e.g., exam scores) for which you want to generate frequency tables, along with additional statistics like mean and standard deviation.
What other advanced analyses are mentioned as available in SPSS in the tutorial?
-The tutorial briefly mentions more advanced analyses available in SPSS, including One-Sample t-tests, Paired Sample t-tests, Analysis of Variance (ANOVA), General Linear Models, Correlation, and Regression.
Outlines

此内容仅限付费用户访问。 请升级后访问。
立即升级Mindmap

此内容仅限付费用户访问。 请升级后访问。
立即升级Keywords

此内容仅限付费用户访问。 请升级后访问。
立即升级Highlights

此内容仅限付费用户访问。 请升级后访问。
立即升级Transcripts

此内容仅限付费用户访问。 请升级后访问。
立即升级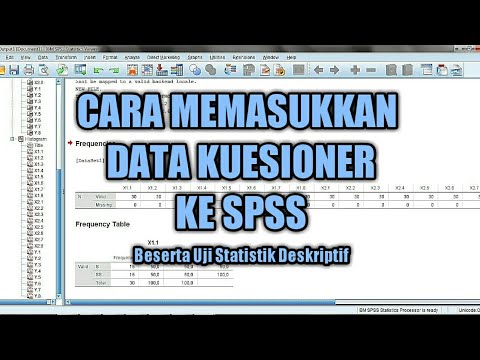


5.0 / 5 (0 votes)
