Ringkasan Praktek Bab 6
Summary
TLDRThis video tutorial provides a comprehensive and fast-paced guide to analyzing data in Excel, focusing on creating tables, calculating averages, rankings, and using logical formulas. The presenter walks through the steps of generating student data, including grades, rankings, and graduation status using Excel functions like SUM, AVERAGE, IF, and VLOOKUP. Additionally, it covers formatting tables, creating charts, and calculating pass/fail statistics. The tutorial concludes with tips for saving the work on a network drive. This concise walkthrough prepares users for an upcoming evaluation, emphasizing accuracy and attention to detail.
Takeaways
- 😀 The guide focuses on preparing data analysis for Chapter 6 in Excel, with a particular emphasis on student assessment.
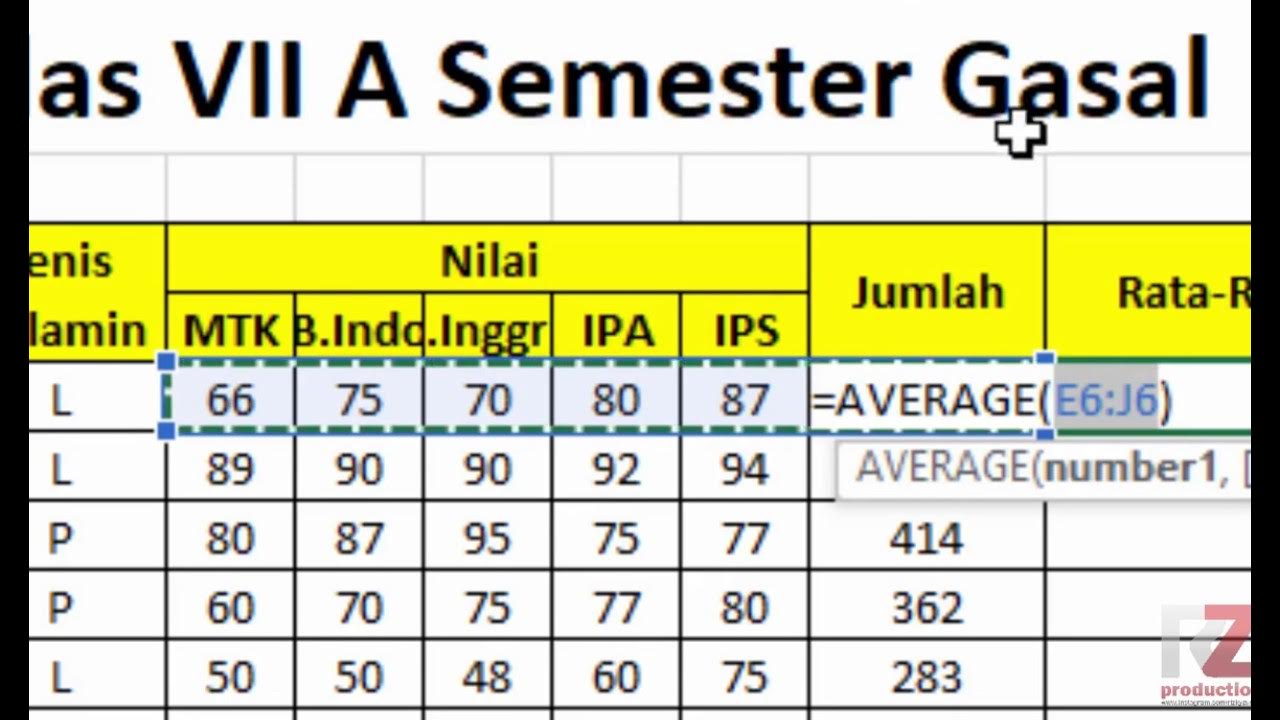
- 😀 The initial step involves creating a table to record student identities, including name, attendance, class, and scores for different subjects.
- 😀 Formulas such as 'RANDBETWEEN' are used to generate random scores between 50 and 100 for students, ensuring variability in data.
- 😀 The 'SUM' function is employed to calculate the total score of each student, followed by calculating their average score using the 'AVERAGE' function.
- 😀 Ranking of students is done using the 'RANK' function, where the average score is compared to others, and adjustments are made to prevent errors in ranking.
- 😀 To determine student status, an 'IF' function is applied. Students scoring below 75 are marked as 'Not Passed' while others are marked as 'Passed'.
- 😀 The 'IF' and 'IFS' functions are also used to assign predicates (e.g., MVP, Gold, Silver, or Bronze) based on students' ranking positions.
- 😀 After entering the data and applying formulas, the table is formatted to ensure clarity, and the results are customized for final reporting.
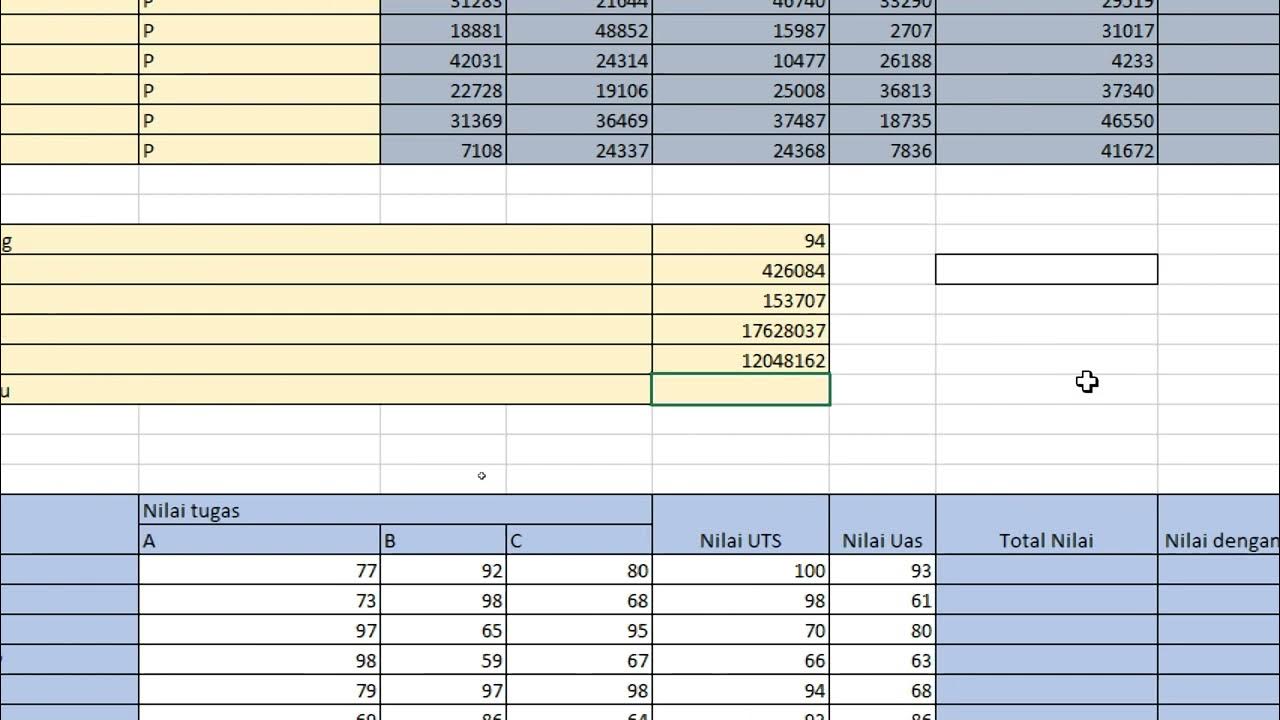
- 😀 A second table is created to input individual subject scores. The 'VLOOKUP' function is used to retrieve scores based on student names selected from a drop-down list.
- 😀 A chart is inserted to visually represent students' scores across subjects, with the option to adjust the chart style and size to suit preferences.
- 😀 Finally, the process of saving the Excel file is demonstrated, with specific instructions on how to save the file on a network drive with a naming convention for easy access.
Q & A
What is the main objective of the script?
-The main objective of the script is to provide a quick guide and summary for preparing a data analysis project in Excel, specifically for a class assessment on Excel skills.
What is the first step in creating the data table as described in the script?
-The first step is to create a table with columns for student identification (name, presence, and class), and other fields like subject scores, average score, ranking, status, and predicate.
How are the student scores generated in the table?
-The student scores are generated using the 'RANDBETWEEN' function, with a lower limit of 50 and an upper limit of 100 to simulate random scores.
What Excel formula is used to calculate the average score for each student?
-The 'AVERAGE' function is used to calculate the average score of each student based on the individual subject scores.
How is the ranking of students determined in the script?
-The ranking is determined using the 'RANK' function, which compares each student's average score against the scores of other students.
What logic is used to determine whether a student passes or fails?
-The student is considered 'passed' if their average score is 75 or above; otherwise, they are marked as 'failed' using an 'IF' formula.
How are the predicates (Gold, Silver, Bronze) assigned to students?
-Predicates are assigned based on the student's rank. If the rank is 1 or 2, the predicate is 'MVP'; ranks 3 to 5 are assigned 'Gold'; ranks 6 to 9 are 'Silver'; and rank 10 is assigned 'Bronze'.
What is the purpose of the 'data validation' feature in the script?
-The 'data validation' feature is used to create a dropdown list for selecting student names, making it easier to assign scores to the correct student.
How is the VLOOKUP function used in the script?
-The 'VLOOKUP' function is used to fetch the scores for each student based on their name, referencing a table array of names and corresponding subject scores.
What additional functionality is added by the script for tracking student performance?
-The script adds a table to track how many students passed or failed, using the 'COUNTIF' function to count the occurrences of 'pass' and 'fail' statuses.
Outlines

此内容仅限付费用户访问。 请升级后访问。
立即升级Mindmap

此内容仅限付费用户访问。 请升级后访问。
立即升级Keywords

此内容仅限付费用户访问。 请升级后访问。
立即升级Highlights

此内容仅限付费用户访问。 请升级后访问。
立即升级Transcripts

此内容仅限付费用户访问。 请升级后访问。
立即升级浏览更多相关视频

Excel in 10 Minutes (Beginner level Tutorial)

Mengubah data tunggal menjadi data berkelompok dengan MS Excel
Materi Excel - Cara Menghitung Jumlah Nilai, Rata-Rata, dan Menentukan Nilai Tertinggi Terendah
Excel Latihan-1

Вправа 17. Математичні та статистичні функції | 9 клас | Бондаренко

Tabelle Pivot - EXCEL TUTORIAL ITALIANO 50
5.0 / 5 (0 votes)
