Statistika Distribusi Frequensi
Summary
TLDRIn this lesson, Kurniawan introduces the topic of frequency distribution, focusing on methods of organizing data systematically. The lecture covers grouping data by time, location, and frequency, and explains key concepts such as range, class intervals, and midpoints. The use of class intervals to simplify large datasets is highlighted, along with calculations for determining the number of classes and class width. Practical examples, such as production data and age group distributions, help students understand how to apply these techniques to real-world data sets. The session aims to equip students with the skills to interpret and organize data effectively.
Takeaways
- 😀 Introduction to frequency distribution and its importance for data organization.
- 😀 The concept of 'seraction' refers to systematic ordering of data in statistics.
- 😀 Time-based data organization includes chronological, historical, and time series data.
- 😀 Data can be categorized and grouped by regions to analyze production capacities across areas.
- 😀 Data can also be grouped based on frequency, such as in the case of demographic data like age categories.
- 😀 Individual data can be organized as raw data or sorted in ascending/descending order.
- 😀 Grouped data refers to sorting data into classes, such as intervals for better analysis and visualization.
- 😀 The importance of determining the range (difference between max and min values) when analyzing grouped data.
- 😀 The creation of frequency tables, which summarize data into different intervals and their corresponding frequencies.
- 😀 Key concepts in frequency distribution: class limits, class boundaries, and mid-class values.
- 😀 Calculating the number of classes needed and interval size using the formula: k = 1 + 3.3 log n.
Q & A
What is the focus of the lesson discussed in the script?
-The focus of the lesson is on frequency distribution and how data can be organized into tables for easier interpretation and analysis.
What does the term 'seraction' refer to in statistics?
-In statistics, 'seraction' refers to the systematic arrangement of data, typically in time series, chronological, or historical order.
What are the types of data arrangement mentioned in the script?
-The script mentions data arrangements based on time (time series, chronological, historical series), area (geographical distribution), and conditions or frequency (based on physical conditions or occurrences over a certain period).
What is meant by 'ungrouped data'?
-Ungrouped data refers to raw data presented in its original form, without any categorization or grouping, often ordered alphabetically or numerically.
What is 'mid class' and how is it calculated?
-The 'mid class' refers to the midpoint of a class interval. It is calculated by averaging the lower and upper limits of the interval.
What are the key components of a frequency distribution table?
-A frequency distribution table includes class intervals, frequency (the number of data points in each class), mid class (the midpoint of each class), and sometimes cumulative frequency or relative frequency.
Why is range important in frequency distribution?
-Range helps to understand the spread between the highest and lowest data points, and it is used to determine the number of classes and the width of each class interval.
How do you determine the number of classes in a frequency distribution?
-The number of classes is determined using the formula k = 1 + 3.3 * log(n), where 'n' is the total number of data points. This value is then rounded to the nearest whole number.
What is the process for determining class intervals?
-To determine class intervals, calculate the range by subtracting the smallest data point from the largest. Then, divide the range by the number of classes to get the class width. The first class interval is formed by starting with the smallest data point and adding the class width for subsequent intervals.
What is the significance of 'class limits' and 'class boundaries' in frequency distribution?
-Class limits refer to the upper and lower boundaries of each class interval. Class boundaries represent the actual smallest and largest values that can fall into the interval, accounting for data precision, such as decimal points.
Outlines

此内容仅限付费用户访问。 请升级后访问。
立即升级Mindmap

此内容仅限付费用户访问。 请升级后访问。
立即升级Keywords

此内容仅限付费用户访问。 请升级后访问。
立即升级Highlights

此内容仅限付费用户访问。 请升级后访问。
立即升级Transcripts

此内容仅限付费用户访问。 请升级后访问。
立即升级浏览更多相关视频
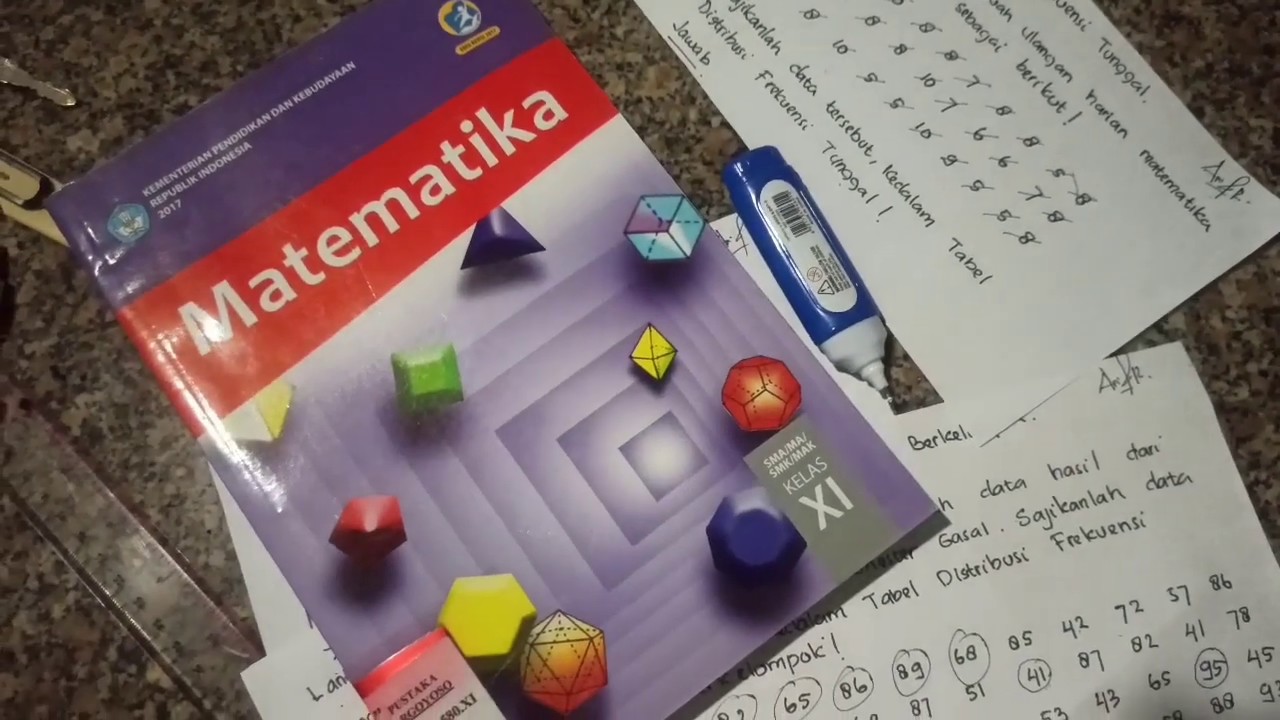
Statistika (Distribusi Frekuensi Data Tunggal dan Kelompok)
Statistika 05 | Distribusi Frekuensi dalam Statistika | Frequency Distribution | Belajar Statistika
KONSEP DASAR STATISTIKA DAN DISTRIBUSI FREKUENSI

26 November 2024

Distribusi Frekuensi: Definisi, Fungsi, dan Jenis-Jenisnya
4.2 | DATA COLLECTION & PRESENTATION | DATA MANAGEMENT | MATHEMATICS IN THE MODERN WORLD | ALOPOGS
5.0 / 5 (0 votes)
