DISTRIBUIÇÃO DE FREQUÊNCIA ✅ ESTATÍSTICA
Summary
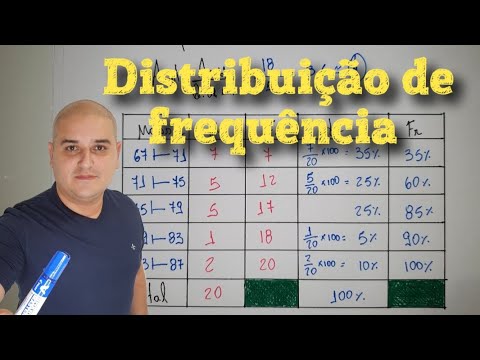
TLDRThis video tutorial teaches how to create a frequency distribution table using data from a dice roll experiment. It covers organizing data in ascending order, calculating absolute frequencies (the number of times each value appears), cumulative frequencies, relative frequencies (as percentages), and cumulative relative frequencies. The instructor walks through a practical example, showing how to sum values and convert results into percentages, ensuring clarity in each step. The video also includes tips for verifying calculations and encourages students to try similar exercises to enhance their understanding of statistics.
Takeaways
- 😀 Organize your data in ascending order to make it easier to create the frequency distribution table.
- 😀 The first step in constructing a frequency distribution is to determine the absolute frequency, which is the number of times each value appears.
- 😀 Absolute frequency is also known as the simple frequency or frequency absolute (f), and it is essential for building the table.
- 😀 To compute the cumulative frequency, add the absolute frequencies in sequence, with the first frequency being equal to its original value.
- 😀 Relative frequency is calculated by dividing the absolute frequency by the total number of observations (data points).
- 😀 Convert the relative frequency into a percentage by multiplying it by 100 to better understand its significance.
- 😀 When computing relative frequency, it’s important to divide the absolute frequency by the total observations to ensure accuracy.
- 😀 The cumulative relative frequency adds up each relative frequency to show the accumulated percentage over time.
- 😀 Check the final cumulative relative frequency to ensure it totals 100% as a verification of your calculations.
- 😀 Always sum the total of frequencies (absolute or relative) to confirm that the total observations are consistent and complete.
- 😀 After completing the table, verify the accuracy of your work by reviewing the totals, both in absolute and relative terms, to ensure consistency.
Q & A
What is the main objective of the video?
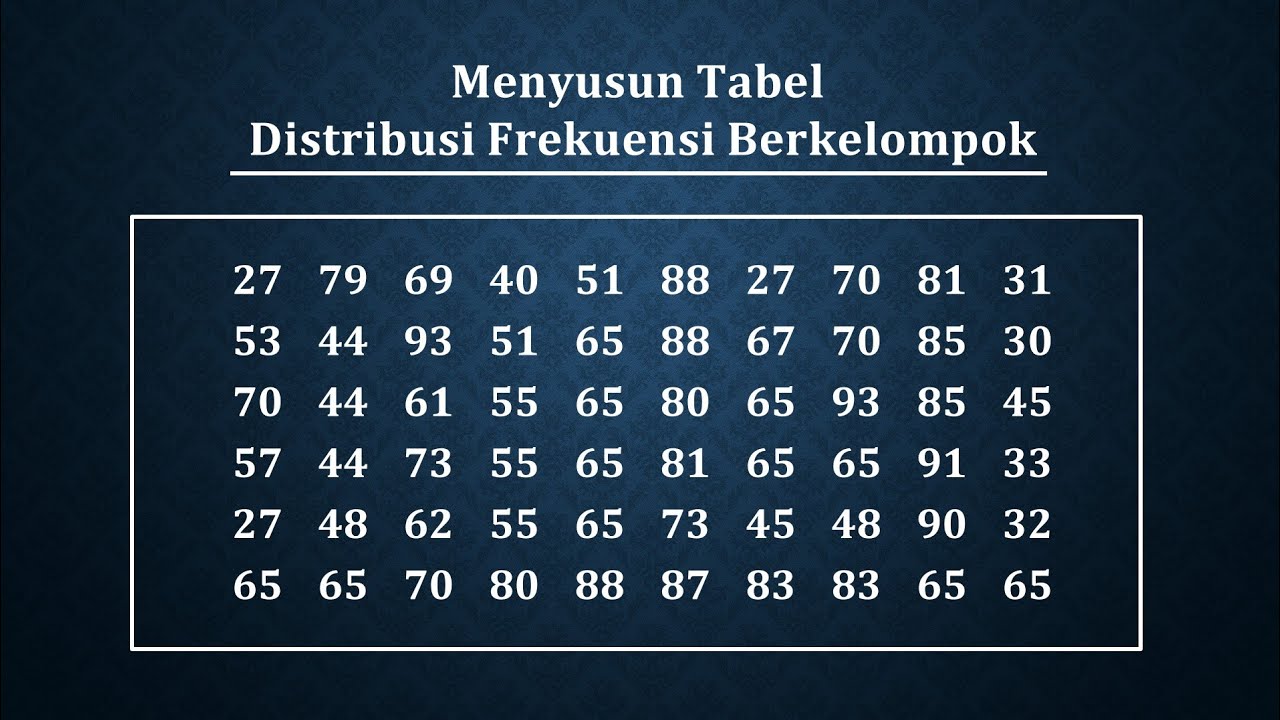
-The main objective of the video is to explain how to construct a frequency distribution table, specifically without class intervals, using the data from a dice roll experiment.
What is the first step to creating the frequency distribution table?
-The first step is to organize the data in ascending order, from the smallest to the largest values, which is referred to as 'rolling' or organizing the data.
What does the 'frequência absoluta' (absolute frequency) represent?
-The 'frequência absoluta' refers to the number of times each value appears in the data set. For example, the number 1 appeared five times, so its absolute frequency is 5.
How do you calculate the cumulative absolute frequency?
-The cumulative absolute frequency is calculated by adding each value's absolute frequency to the sum of the previous values. For instance, you start with the first frequency and progressively add the next frequencies.
What is the purpose of the 'frequência relativa' (relative frequency)?
-The 'frequência relativa' shows how often a value occurs in relation to the total number of data points. It is calculated by dividing the absolute frequency of a value by the total number of data points and then multiplying by 100 to express it as a percentage.
What is the importance of converting the relative frequency to a percentage?
-Converting relative frequency to a percentage makes it easier to interpret and understand the distribution, as it represents the proportion of each value in relation to the total in a more intuitive format.
How do you calculate the relative frequency for the number 2?
-To calculate the relative frequency for the number 2, divide its absolute frequency (2) by the total number of rolls (20), which gives 0.1, and then multiply by 100 to get 10%.
What should the sum of the relative frequencies equal?
-The sum of the relative frequencies should equal 100%, as this represents the total distribution of the data.
How do you calculate the cumulative relative frequency?
-To calculate the cumulative relative frequency, add each relative frequency to the previous cumulative total, starting with the first relative frequency.
What is the final step after completing the frequency distribution table?
-The final step is to check the cumulative relative frequencies, which should total 100%, ensuring that the distribution is complete and correct.
Outlines

此内容仅限付费用户访问。 请升级后访问。
立即升级Mindmap

此内容仅限付费用户访问。 请升级后访问。
立即升级Keywords

此内容仅限付费用户访问。 请升级后访问。
立即升级Highlights

此内容仅限付费用户访问。 请升级后访问。
立即升级Transcripts

此内容仅限付费用户访问。 请升级后访问。
立即升级浏览更多相关视频


5.0 / 5 (0 votes)
