Tutorial on creating a Baseline Scan in Windows Server 2022
Summary
TLDRThis tutorial covers how to establish a performance baseline on a Windows Server using Performance Monitor. By setting up data collector sets and tracking key metrics such as CPU, memory, disk I/O, and network usage, administrators can observe normal resource drift over time. The video highlights how comparing real-time performance data with the baseline can help identify potential issues like malware or system bottlenecks. The goal is to maintain a secure and efficient server environment by detecting anomalies in system behavior through detailed performance reports.
Takeaways
- 😀 A baseline is established during the initial installation of a Windows Server to monitor system resource usage before deployment.
- 😀 A baseline helps track normal resource usage and identify deviations, which can indicate potential issues, including malware.
- 😀 Performance Monitor in Windows Server is used to create and track baselines, offering insights into CPU, memory, disk, and network performance.
- 😀 The Data Collector Set in Performance Monitor enables users to monitor various system metrics, such as processor performance and network interfaces.
- 😀 Templates like 'System Performance' in Performance Monitor offer pre-configured sets of counters, making baseline creation easier.
- 😀 Data collection periods can vary based on the situation; longer collection times are typical for normal use, while shorter periods (10 minutes to 1 hour) are used when investigating malware.
- 😀 Once data is collected, administrators can generate reports to analyze system performance and identify potential problems.
- 😀 Anomalies in CPU, disk I/O, network usage, or memory can indicate issues such as malware infections or resource bottlenecks.
- 😀 High network traffic or CPU utilization can be signs of a malware outbreak, as it may cause abnormal data transmission or system load.
- 😀 A comparison of current system performance against the baseline helps to identify abnormal resource usage patterns that may be caused by malware or other issues.
- 😀 Regular monitoring of system performance using baselines is a crucial cybersecurity measure to detect and prevent malware and ensure system health.
Q & A
What is a baseline in the context of a Windows Server?
-A baseline in this context refers to the initial performance metrics recorded on a Windows Server immediately after installation. It captures the normal resource usage patterns of the server, which can be used for future comparisons to detect deviations or performance issues.
How does resource drift relate to baseline monitoring?
-Resource drift is the gradual increase in resource usage over time as additional applications or workloads are added to the server. By monitoring the baseline, system administrators can track this drift and distinguish between normal increases in usage and abnormal changes that may indicate issues like malware.
Why is it important to monitor for malware using performance data?
-Monitoring performance data helps identify abnormal resource usage patterns that may indicate malware activity, such as unusual CPU usage, high disk I/O, or excessive network traffic. Early detection of such anomalies allows for quick action to mitigate potential security threats.
What is the role of Performance Monitor in Windows Server?
-Performance Monitor is a built-in tool in Windows Server that allows administrators to track and measure system resource usage over time. It provides detailed data on various metrics like CPU usage, memory, disk I/O, and network activity, which helps in troubleshooting, performance tuning, and malware detection.
What are Data Collector Sets in Performance Monitor?
-Data Collector Sets in Performance Monitor are configurations that allow the system to collect performance data based on specific counters. Administrators can use predefined templates or create custom sets to monitor various system parameters such as CPU performance, memory, disk I/O, and network activity.
What is the difference between the System Performance template and user-defined collector sets?
-The System Performance template is a predefined set of counters in Performance Monitor that tracks essential system metrics like CPU usage, disk I/O, and memory. A user-defined collector set, on the other hand, allows administrators to create custom sets tailored to specific monitoring needs or additional parameters.
How long should data be collected to monitor for malware effectively?
-For effective malware monitoring, data should be collected for a shorter period (e.g., 10 minutes to an hour) to quickly detect any anomalies in resource usage. However, for general performance monitoring, data collection can be extended to several days or weeks.
What signs should administrators look for when analyzing performance data for malware?
-Signs of malware in performance data include unusually high CPU usage, abnormal disk I/O, excessive memory consumption, or abnormal network activity (such as 100% network utilization), which could indicate malware spreading across the network or consuming system resources.
How can administrators use Performance Monitor reports to detect system issues?
-By comparing the collected performance data against the baseline, administrators can identify deviations that may indicate system issues such as resource bottlenecks, hardware limitations, or malware infections. These reports provide insights into resource usage patterns and help pinpoint the cause of any abnormal behavior.
What role does process analysis play in detecting malware using Performance Monitor?
-Process analysis helps identify which processes are consuming abnormal amounts of resources, such as CPU time or memory. Unusual process behavior or excessive resource usage by unfamiliar or unexpected processes could signal the presence of malware, allowing administrators to take corrective action.
Outlines

此内容仅限付费用户访问。 请升级后访问。
立即升级Mindmap

此内容仅限付费用户访问。 请升级后访问。
立即升级Keywords

此内容仅限付费用户访问。 请升级后访问。
立即升级Highlights

此内容仅限付费用户访问。 请升级后访问。
立即升级Transcripts

此内容仅限付费用户访问。 请升级后访问。
立即升级浏览更多相关视频

Performance Monitor Tutorial for Windows

How to setup NIC Teaming on Windows Server

How to create a File server for a small company

How To: Route 53 Health Checks (4 Min) | AWS | Monitor Health & Performance Of Your Web Application

Membuat FTP Server dan FTP Client pada Windows 10

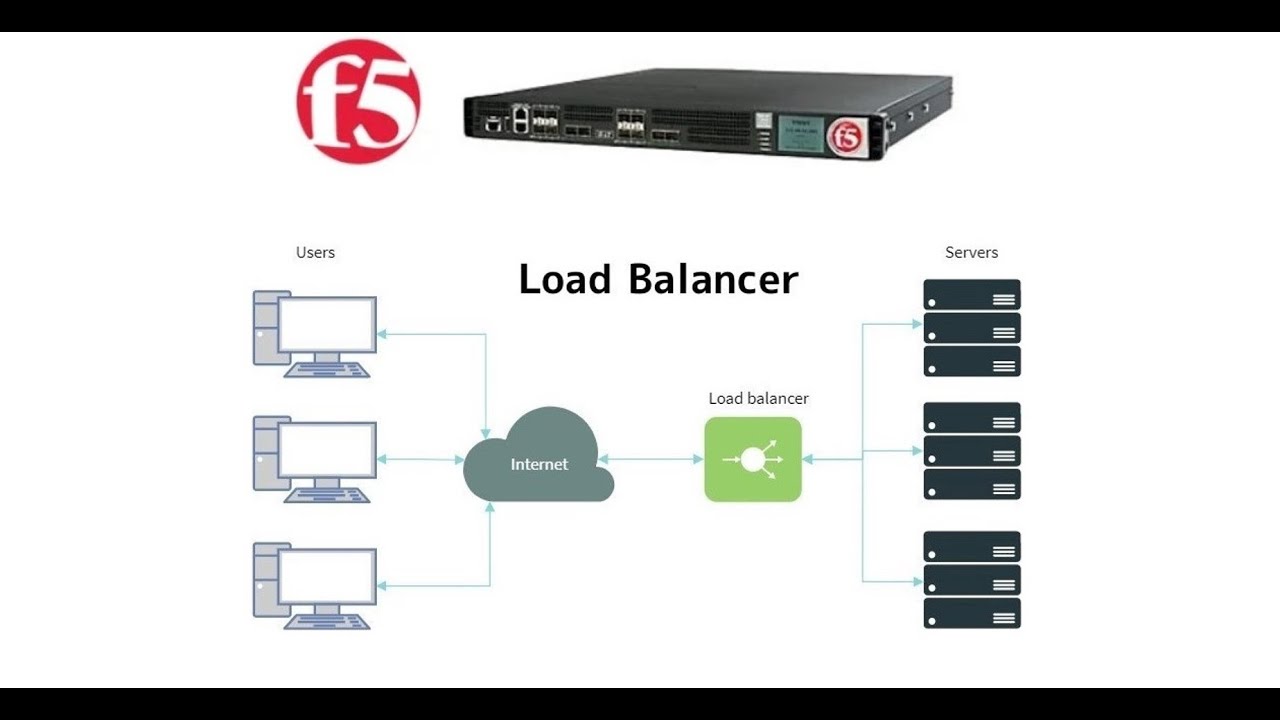
2. F5 Big IP LTM (Local Traffic Manager) || Load Balancer Explained
5.0 / 5 (0 votes)
