Machine Learning Tutorial Python - 8: Logistic Regression (Binary Classification)
Summary
TLDRThis tutorial introduces logistic regression as a technique for solving classification problems, where the prediction is categorical rather than continuous as in linear regression. The video explains the concept of binary and multi-class classification, using the example of predicting customer insurance purchases based on age. It demonstrates how to visualize data with a scatter plot and how linear regression might be inappropriate for certain datasets. The presenter then introduces the sigmoid function, which logistic regression uses to model the probability of a certain class. The tutorial continues with a practical example using a dataset, showing how to perform a train-test split, train a logistic regression model, make predictions, and evaluate the model's accuracy. Finally, the video concludes with an exercise for viewers to apply logistic regression to an HR Analytics dataset to predict employee retention.
Takeaways
- 📈 The tutorial aims to solve a simple classification problem using logistic regression, which is different from linear regression that predicts continuous values.
- 🔍 Classification problems predict categorical outcomes, such as yes/no or choosing among multiple categories.
- 📊 Binary classification involves predicting an outcome with only two categories, while multi-class classification deals with more than two categories.
- 📉 The script demonstrates using a scatter plot to visualize data distribution, which helps in identifying patterns in the data before applying logistic regression.
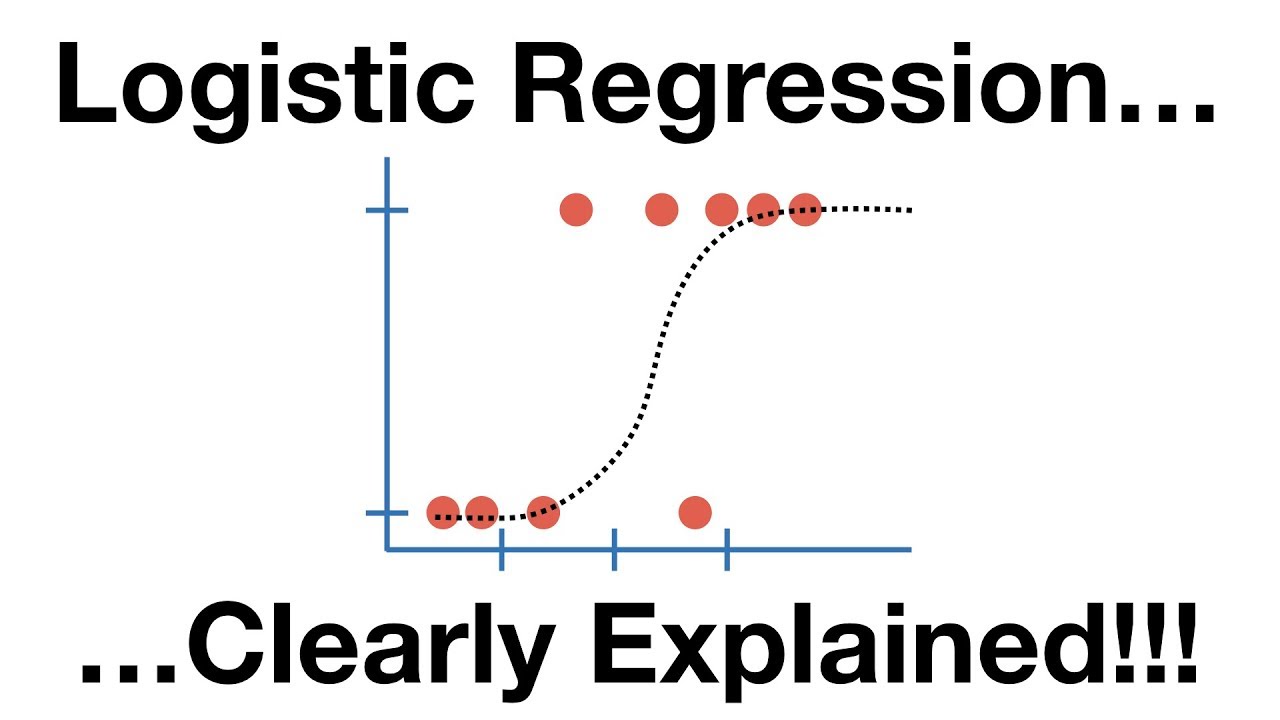
- 🤖 Logistic regression models use a sigmoid function to transform linear equation outputs into a probability range between 0 and 1.
- 🧮 The sigmoid function has an S-shaped curve, mathematically represented as 1 / (1 + e^(-z)), where 'e' is Euler's number.
- 📝 The tutorial covers how to implement logistic regression using the scikit-learn library in Python, abstracting the complex mathematics.
- ⏭️ The process includes data splitting into training and test sets, model training with the training set, and making predictions with the test set.
- 💯 The accuracy of the logistic regression model is evaluated using the test set, with a score close to 1 indicating a high accuracy for the given dataset.
- 🤓 The script suggests exploring Kaggle for various datasets to practice building logistic regression models and solving real-world problems.
- 📚 The exercise at the end of the tutorial challenges learners to apply logistic regression to an HR Analytics dataset to predict employee retention.
- 🔧 The exercise involves exploratory data analysis, plotting bar charts for salary and department impact, building a logistic regression model, making predictions, and measuring model accuracy.
Q & A
What is the main goal of the tutorial?
-The main goal of the tutorial is to solve a simple classification problem using logistic regression.
What is the difference between linear regression and classification problems?
-Linear regression is used to predict continuous values, such as home prices or stock prices, while classification problems predict categorical values, such as yes/no or selecting one category from multiple options.
What are the two types of classification problems mentioned in the script?
-The two types of classification problems mentioned are binary classification, which involves predicting a simple yes or no outcome, and multi-class classification, which involves predicting one category from more than two available options.
How does logistic regression differ from linear regression in terms of the output it provides?
-Logistic regression provides an output that is a probability ranging between 0 and 1, which can be used to classify the prediction into categories, whereas linear regression provides a continuous output that can be any number.
What is the sigmoid function and how is it used in logistic regression?
-The sigmoid function is a mathematical function that takes any input and transforms it into a value between 0 and 1. It is used in logistic regression to convert the linear equation's output into a probability score that can be used for classification.
What is the purpose of splitting the dataset into a training set and a test set?
-The purpose of splitting the dataset is to use the majority of the data (training set) to train the model and a smaller portion (test set) to evaluate its performance and ensure that it generalizes well to new, unseen data.
How does the logistic regression model make predictions?
-The logistic regression model makes predictions by applying the sigmoid function to a linear equation derived from the training data. The output of the sigmoid function is then used to classify the prediction into one of the categories.
What is the significance of the score returned by the logistic regression model?
-The score returned by the logistic regression model represents the accuracy of the model. It is a measure of how well the model's predictions match the actual outcomes in the test set.
How can the logistic regression model predict the probability of an event occurring?
-The logistic regression model can predict the probability of an event occurring by applying the sigmoid function to the linear equation's output. The resulting probability score indicates the likelihood of the event.
What is the purpose of exploratory data analysis in the context of the HR Analytics dataset?
-The purpose of exploratory data analysis is to identify patterns and relationships within the data that can help understand factors affecting employee retention or attrition. This can inform the development of a logistic regression model to predict employee retention.
What are the steps involved in building a logistic regression model for the HR Analytics dataset?
-The steps involved include: 1) Exploratory data analysis to identify key factors affecting employee retention, 2) Plotting bar charts to visualize the impact of factors like salary and department on retention, 3) Building a logistic regression model using the identified factors, 4) Making predictions with the model, and 5) Measuring the model's accuracy.
Outlines
📊 Introduction to Logistic Regression for Classification Problems
The video begins by contrasting logistic regression with linear regression. While linear regression is used for predicting continuous values, logistic regression is introduced as a method for solving classification problems, which involve predicting categorical outcomes. The tutorial aims to address binary classification, where the outcome is a simple yes or no, and multi-class classification, where there are more than two categories to predict. An example scenario is given where a data scientist is tasked with predicting whether a potential customer will buy life insurance based on their age. The importance of plotting data and observing patterns is emphasized before introducing logistic regression as the solution for such predictive tasks.
📈 Fitting a Logistic Regression Model to Insurance Data
The paragraph explains the process of using logistic regression to model the likelihood of a customer buying insurance based on their age. It discusses the limitations of linear regression in classification tasks and introduces the sigmoid function as a method to transform a linear equation's output into a probability value between 0 and 1. The sigmoid function is mathematically defined, and its S-shaped curve is described. The video then demonstrates how to implement logistic regression using a library like scikit-learn, abstracting away the complex mathematics. The process includes loading data, plotting a scatter plot to visualize the data distribution, and splitting the dataset into training and test sets. The logistic regression model is trained using the training set, and its accuracy is evaluated using the test set.
🤖 Training the Logistic Regression Model and Making Predictions
This section details the steps to train a logistic regression model using the training data and then make predictions on the test data. The model's predictions are binary, indicating whether the customer will buy insurance (1) or not (0). The accuracy of the model is assessed by comparing its predictions to the actual outcomes, and the model's score接近 1, indicating near-perfect accuracy. However, the presenter notes that this high score is partly due to the small dataset size. The paragraph also covers how to predict the probability of an outcome using the model, which provides a more nuanced understanding of the prediction's certainty.
📚 Exercise: Applying Logistic Regression to HR Analytics
The final paragraph transitions into an exercise where viewers are encouraged to apply logistic regression to a real-world dataset focusing on employee retention rates. The task involves exploratory data analysis to identify factors affecting employee retention, plotting bar charts to visualize the impact of salary and department on retention, and building a logistic regression model to predict employee attrition. The exercise aims to help HR departments focus on specific areas to improve employee retention. The video concludes with a prompt for viewers to share their findings in the comments and to attempt the exercise independently before consulting the provided answers.
Mindmap
Keywords
💡Logistic Regression
💡Binary Classification
💡Sigmoid Function
💡Linear Regression
💡Outliers
💡Model Training
💡Test Size
💡Predictive Model
💡Data Set
💡Accuracy
Highlights
The tutorial aims to solve a simple classification problem using logistic regression, contrasting with linear regression which predicts continuous values.
Classification problems predict categorical outcomes, such as yes/no or choosing among multiple options.
Binary classification predicts a simple yes or no outcome, while multi-class classification involves more than two categories.
Logistic regression is introduced as a technique to solve classification problems, different from linear regression.
The tutorial provides a real-world example of predicting customer insurance purchase likelihood based on age.
A scatter plot is used to visualize data distribution and identify patterns before applying logistic regression.
Linear regression is shown to be inadequate for classification problems with non-linear data.
The sigmoid or logit function is explained as a mathematical tool that logistic regression uses to model probabilities.
The sigmoid function maps any input to a range between 0 and 1, creating an S-shaped curve.
Logistic regression combines a linear equation with a sigmoid function to predict the likelihood of a categorical outcome.
The tutorial demonstrates using the scikit-learn library to implement logistic regression without manually coding the mathematics.
Data is split into training and test sets using the train_test_split method for model evaluation.
The logistic regression model is trained using the training data and then used to make predictions on the test data.
The model's accuracy is assessed using the test data and the score method, which returns a value between 0 and 1.
The tutorial also covers predicting the probability of an outcome using the logistic regression model.
An exercise is provided to apply logistic regression to an HR Analytics dataset for predicting employee retention.
The exercise encourages exploratory data analysis to identify factors affecting employee retention.
Participants are guided to build a logistic regression model, make predictions, and measure the model's accuracy.
The tutorial concludes with a call to action for viewers to attempt the exercise and think critically about the solutions.
Transcripts
the goal of this tutorial is to solve a
simple classification problem using
logistic regression if you followed my
previous tutorial we have learnt a lot
about linear regression especially the
home prices example linear regression
can be used to predict other things such
as weather and stock prices and in all
these examples the prediction value is
continuous there are other type of
problems such as predicting weather
email spam or not whether the customer
will buy the life insurance product or
person is going to vote for which party
all these problems if you think about it
the prediction value is categorical
because the thing that you are trying to
predict is one of the available
categories in the first two example it
is simple yes or no answer in the third
examples it is one of the available
categories whereas in case of linear
regression the home prices example we
saw that the predicted value could be
any number it is not one of the defined
categories okay hence this second type
of problems is called classification
problem and logistic regression is a
technique that is used to solve these
classification problems now in the
classification examples that we saw
there are two types so the first example
was predicting whether customer will buy
insurance or not here the outcome is
simple yes or no this is called binary
classification on the other hand when
you have more than two categories that
example is called multi class
classification
let's say you are working as a data
scientist in a life insurance company
and your boss gives you a task of
predicting how likely a potential
customer is to buy your insurance
product and what you are seeing here is
the available data
and based on the age the information you
have is whether customer bought the
insurance or not now here you can see
some patterns such as young people don't
buy the insurance too much you can see
like there are persons with 20 to 25
these kind of ages where zero means they
didn't buy the insurance whereas as the
persons age increases he's more likely
to buy the insurance so you know the
relationship and you want to build a
machine learning model that can do a
prediction based on the age of a
potential customer so as a data
scientist now this is the job you have
been given now the first thing you would
do when you have this data is you will
plot a scatter plot which looks like
this when you have walked on linear
regression problems already the first
temptation you have in your mind is you
start using linear regression so when
you draw our linear equation line using
the linear regression it will look
something like this now how did we come
up with this line for that you can
follow my previous linear regression
tutorials if you think about it what I
can do here is I can predict the value
using a linear equation line and say
that if my predictive value is more than
0.5 so here this is 0.5 if it is more
than 0.5 then I will say ok customer is
likely to buy the insurance if it is
less than that then he is not going to
buy the insurance so anything on the
right hand side is yes anything on the
left hand side is no now of course we
have these outliers but we don't care
about them too much because for 90% of
the cases of our linear regression will
work ok now imagine you have a data
point which is far on the right-hand
side here so say a customer whose age is
more than 80 years let's say he bought
your insurance ok then your scatterplot
will look like this and your linear
equation
might look like this in this case what
will happen is when I draw a separation
between between the two sections using
0.5 value here the problem arises with
these data points actually the answer
was yes here
but my question predicted them to be no
so you can see that this is pretty bad
when you use linear regression for data
a class like this now here is the most
interesting part imagine you can draw a
line like this this is much better fit
compared to the previous linear equation
that we had okay and here when you draw
a separation between Z using 0.5 value
you can clearly say that this model
works much better than the previous one
the question arises what is this line
exactly and how do you come up with this
right if you have learnt statistics you
might have heard about sigmoid or logit
function and that's what this is okay
now
the moment you hear this term sigmoid
you might pause this video and start
googling about sigmoid and it is fine
you can read all the articles about
Sigma or logic logit function to get
your understanding correct on
mathematics behind it
but if you don't want to do it I will
give you a basic idea the Sigma
functions equation is 1 divided by 1
plus e raised to minus Z where e is some
mathematical constant is called Europe
Euler's numbers the value is this now
think about this equation for a moment
what we are doing here is we are
dividing by 1 by a number which is
slightly greater than 1 and when you
have this situation the outcome will be
less than 1 correct
so all you are doing with this
my function is coming up with a range
which is between zero to one so if you
feed set of numbers to the sigmoid
functions all it will do is convert them
to zero to one range and the equation
that you will get it looks like s-shape
right so if you plot a 2d plot 2d chart
it will look like a shape function that
we saw in the previous slide essentially
what we are doing with logistic
regression is we have a line like this
which is linear equation and you know
the equation for our linear line which
is MX plus B all you're doing is you are
feeding this line into a sigmoid
function and when you do that you
convert this line into this a shape ok
so here you can see that my Z I replace
with MX plus B so I applied sigmoid
function on top of my linear equation
and that's how I got my has shaped line
here all right now all of this math is
just for your understanding as a next
step we are going to write logistic
regression using SQL on library and
these details are abstracted for you so
don't worry about it you don't have to
implement all of this mathematics you
will just make a one simple call and it
will work magically for you all right so
let's get straight into writing the code
here is the CSV file containing the
insurance data you can see there are two
columns age and whether that person
bought the insurance or not and we are
going to import this into our panda's
data frame so I have loaded my Jupiter
notebook by running Jupiter notebook
come on on my command line imported
couple of important libraries and then I
imported the same CSV file into my data
frame which looks like this and now I'm
going to plot
a scatterplot just to see the data
distribution and you can see that I get
a plot like this here these are the
customers who didn't buy the insurance
these are the ones who bought the
insurance and you can see that if the
person is younger he's less likely to
buy the insurance and as the person gets
older he is more likely to buy the
insurance the first thing now we are
going to do is use trained taste split
method to split our data set so if you
look at our data we have 27 rows so we
are going to split these rows into
training set and test set again I have a
separate tutorial for how to do train
and test split so you can watch that it
is basically from Escalon model
selection you import train taste split
method here my X is DF age now I am
doing doing two brackets because the
first parameter is X which has to be
multi-dimensional array so I'm using I'm
just trying to derive a data frame here
and what insurance is why and I will say
what is my taste size if you want to see
the arguments you can do shift tab and
it will show you a help for this
function so I used this a lot
it is pretty useful so let's see so
there is this taste underscore size
parameter so let's use taste and just
core size we are going to do or less
less a train size right so training size
is 0.9 so 90% of the example we are
using for training and 10% we will use
for actually testing over model
now what do you get back as a result so
these are the things you get back as it
is all so I'm just going to copy from
here and that's it hit ctrl enter to run
it okay so here there's some warning
maybe they are asking us to use test
size doesn't matter okay
let's look at our test so what test is
18 23 and 40 so these are the three
values we are going to perform or taste
on when you look at our X train these
are these are the data samples we will
use to train our model all right so
let's now import logistic regression so
from same linear model you can import
logistic regression logistic education
eske lon alright so we even have
logistic regression class in ported and
we are going to create an object of this
class we'll call it a model and that
model now we'll do a training remember
in SQL and whenever you are using this
method fit you are actually doing your
training for your model so X train
invite train this is what you use for
your training when you execute this this
means your your model is trained now and
it is ready to make predictions so what
these three values we are making a
prediction so I will do model dot
product and X paste so here what it is
saying is 0 0 1 which means first two
samples it is saying these two customers
are not going to buy your insurance and
you can see that it's kind of working
because they have age of 18 and 23 year
old and we saw that as the ages the
younger age people do not buy the
insurance whereas I think anything more
than 27 28 to buy so here the age is 40
so the answer was 1 okay if you want to
look at the score score is nothing but
it is showing the accuracy of your model
right so what you're doing is you're
giving X tests invitees and here the
score is 1 which means our model is
perfect now this is happening because
our data size is smaller we have only 27
samples but if you have more wider
samples then it will make mistakes in at
least few samples so your score will be
less than 1 right because of the small
size of our data set the score is pretty
high here
another method to try is you can see
that benefit by the way tab it will show
you all the possible functions that
start with ready okay so here you can
also predict a probability so when you
predict a probability of X test it will
show you a probability of your data
sample being in one class versus the
other the first class here is if
customer will not buy the insurance so
for the age 18 and 23 you can see this
point six percent probability that they
will not buy the insurance whereas for
the person with age forty it is reverse
there is 0.6 percent poverty that he
will buy the insurance and point thirty
nine percent probability that he will
not point thirty nine percent really
it's really thirty nine percent that he
will not buy the insurance if you want
to do one off then you can just do model
predict this six you will buy the
insurance that's why you had one and if
you had something like twenty five he
will not buy the insurance that's why
you get zero so this model that we built
is working back pretty well with
logistic regression that's all I had and
now is the time for exercise so if you
know about Cagle of website this is the
website that hosts different coding
competitions and it has one of the more
important feature which is the data sets
so if you go to this data set section
you can download various data sets based
on the type based on the file type or
you can even search for data set so if
you want to do some Titanic Titanic data
analysis you can search for that
basically you can just explore these
data sets for exercises from this I have
downloaded this HR Analytics data set
where there is an analysis on the
employee retention rate or
employee attrition rate if I open that
CSV file here it looks like this where
based on the satisfaction level there's
no number of projects or average monthly
hours that person has worked on you are
trying to establish the correlation
between those factors and whether person
would leave the form or whether he would
continue with the form these kind of
analytics are very important for HR
department because they want to retain
the employees and if you can build a
machine learning model for HR department
then they can focus on specific areas so
that employees don't leave at the farm
so that's what you're going to do you
are a data scientist you're going to
work for your HR department and give
them a couple of things so I have
mentioned all of those things in the
Jupiter notebook which I have available
in the video description below so if you
open that notebook you will see all the
code that we just went through in this
tutorial and at the end you will find
this exercise section ok so there is a
link here you download the data set if
you don't want to download it the same
level as this notebook there is an
exercise folder so download the CSV from
that and you're going to give answer on
these five questions ok first one is out
of all these parameters that we have you
want to find out which factors affect
the employee retention by doing some
exploratory data analysis you will also
plot bar charts showing the impact of
employees salaries and retention also
plot the bar chart showing the impact of
department and employee retention and
then using the factors that you figured
in step one you will build a logistic
regression model and using the model you
are going to do some prediction in the
end you will measure the accuracy of the
model let's do that exercise in the
comments below let
know your answers and if you want to
verify the answers then I have a
separate notebook at the same level in
exercise folder which has all the
answers but don't look at the answers
directly okay a good student is someone
who tries to find the solution on his
own and then he looks at the answer all
right that's all we had thank you very
much for watching I'll see you next
浏览更多相关视频
Machine Learning Tutorial Python - 8 Logistic Regression (Multiclass Classification)
Logistic Regression Using Excel
StatQuest: Logistic Regression
Machine Learning Tutorial Python - 3: Linear Regression Multiple Variables
Logistic Regression Part 2 | Perceptron Trick Code
Simple Linear Regression in R | R Tutorial 5.1 | MarinStatsLectures
5.0 / 5 (0 votes)