Macroeconomics- Everything You Need to Know
Summary
TLDRIn this comprehensive overview, Jacob Clifford covers the essentials for an introductory macroeconomics class, including the concept of scarcity, production possibilities curve, comparative advantage, and economic systems. He delves into macroeconomic measures such as GDP, inflation, unemployment, and fiscal policy, as well as monetary policy and the intricacies of international trade and exchange rates. The video serves as a valuable review for students preparing for exams and a tool for identifying knowledge gaps.
Takeaways
- 📘 Introduction to Economics: The video covers essential concepts for an introductory宏观经济学 class, focusing on scarcity, opportunity costs, and the production possibilities curve.
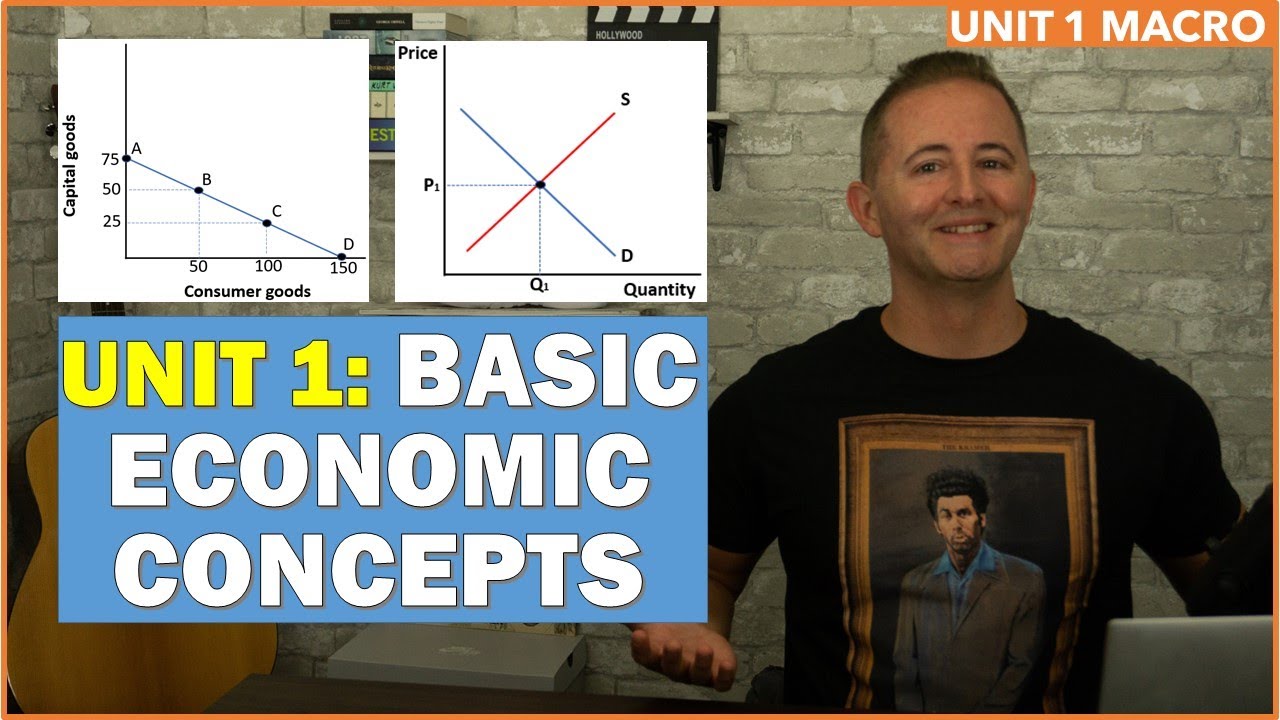
- 📈 Understanding the Production Possibilities Curve: The curve shows efficient, inefficient, and impossible production points and can shift due to changes in resources or technology.
- 🌍 Comparative Advantage: Countries should specialize in products where they have lower opportunity costs, leading to efficient trade between them.
- 💰 Economic Systems: The video provides an overview of different economic systems like free market capitalism, command economy, and mixed economy, with a focus on capitalism.
- 🔄 Circular Flow Model: The model illustrates the interactions between businesses, individuals, and the government in an economy, highlighting product and resource markets.
- 📊 Demand and Supply: The basic principles of demand and supply, including equilibrium, shifts, and the concepts of shortage and surplus, are discussed.
- 📈 Macroeconomic Measures: The three goals of an economy are growth, low unemployment, and stable prices, with GDP being a central measure of economic activity.
- 💵 Money and Banking: The unit on money introduces the functions of money, the banking system, and the money multiplier effect.
- 📊 Fiscal Policy: The video explains the use of fiscal policy through government spending and taxation to influence the economy, including the concepts of spending and tax multipliers.
- 🌐 International Trade and Foreign Exchange: The final unit covers the balance of payments, foreign exchange rates, and the impact of currency appreciation and depreciation on trade.
- 🎓 Study Tips: The video is designed as a quick review for exams, encouraging students to identify areas of strength and weakness for targeted study.
Q & A
What is the primary purpose of the video?
-The primary purpose of the video is to provide a quick review and preparation guide for students taking an introductory macroeconomics class or an AP macroeconomics exam.
What is the concept of scarcity in economics?
-Scarcity in economics refers to the fundamental economic problem where human wants are unlimited, but resources are limited, leading to the necessity of making choices and trade-offs in the allocation of resources.
How is the production possibilities curve (PPC) used to illustrate efficiency and opportunity costs?
-The PPC is used to show the maximum attainable combinations of two goods given the available resources. Points on the curve represent efficient combinations where resources are fully utilized. Points inside the curve indicate inefficiency, while points outside the curve are unattainable given current resources.
What are the two shapes of the production possibilities curve and what do they represent?
-The two shapes are the straight line and the concave (or 'bowl-shaped') curve. A straight line PPC indicates constant opportunity costs, meaning resources are very similar for producing different products. A concave curve indicates increasing opportunity costs, meaning resources are not similar, and producing more of one good requires giving up more of the other good.
What is the law of comparative advantage and how does it relate to trade?
-The law of comparative advantage states that countries should specialize in the production of goods for which they have the lowest opportunity cost. This allows countries to trade with each other, exchanging goods they can produce efficiently for those they are less efficient at producing, leading to mutual benefits.
How does the circular flow model illustrate the interactions between different economic agents?
-The circular flow model shows the interactions between businesses, individuals, and the government. Businesses sell products and buy resources (factors of production), individuals buy products and sell their resources, and the government provides public services and redistributes income through transfer payments and subsidies.
What are the three goals of every economy?
-The three goals of every economy are to grow over time (production of more goods and services), to keep unemployment low, and to maintain stable prices (limiting inflation).
How is GDP calculated using the expenditure approach?
-GDP is calculated using the expenditure approach by adding up all the spending on final goods and services in the economy, which includes consumption (C), investment (I), government spending (G), and net exports (X - M).
What is the difference between nominal and real GDP?
-Nominal GDP is the market value of all final goods and services produced in a year without adjustment for inflation. Real GDP adjusts for inflation, providing a more accurate reflection of the economy's actual production and growth.
What are the three causes of inflation?
-The three causes of inflation are an increase in the money supply (quantity theory of money), demand-pull inflation (where demand outpaces supply, causing prices to rise), and cost-push inflation (where increased production costs lead to higher prices).
How does the Phillips curve illustrate the relationship between inflation and unemployment?
-The Phillips curve shows an inverse relationship between inflation and unemployment in the short run, suggesting that higher inflation is associated with lower unemployment and vice versa. In the long run, the curve is vertical, indicating no relationship between inflation and unemployment as the economy converges to its natural rate of unemployment.
Outlines
📚 Introduction to Macroeconomics and Scarcity
This paragraph introduces the viewer to the basics of macroeconomics, emphasizing the concept of scarcity and the production possibilities curve. It explains the ideas of unlimited wants versus limited resources, opportunity costs, and the efficient allocation of resources. The video aims to prepare students for their AP宏观经济学考试 or final exams, offering a quick review of essential concepts rather than a comprehensive re-teaching. The speaker also promotes his Ultimate Review Pack, a resource for further practice and understanding of economics.
📈 Understanding Macro Measures and GDP
The second paragraph delves into the three primary goals of every economy: growth over time, low unemployment, and stable prices. It introduces the concept of GDP (Gross Domestic Product) as a measure of economic activity and explains how to calculate it using both the expenditure and income approaches. The paragraph also discusses the importance of distinguishing between nominal and real GDP, the business cycle, and the different types of unemployment, including frictional, structural, and cyclical unemployment. Additionally, it touches on the labor force participation rate and the natural rate of unemployment.
💰 Inflation, Unemployment, and Fiscal Policy
This paragraph covers the concepts of inflation, deflation, and their impact on wages and interest rates. It explains the Consumer Price Index (CPI) and how it measures price changes over time. The deflator, which adjusts nominal GDP for inflation, is introduced as a key concept. The paragraph also discusses the causes of inflation, including excessive money printing, demand pull, and cost push. Fiscal policy, which involves government spending and taxation, is explained as a tool to manage economic performance, with a focus on expansionary and contractionary policies. The spending multiplier effect and the potential issues with fiscal policy, such as government debt and crowding out, are also discussed.
📉 Aggregate Demand, Supply, and Economic Fluctuations
The fourth paragraph introduces aggregate demand and supply, explaining their downward and upward sloping curves, respectively. It discusses the factors that cause these curves to shift and the implications for the economy, including recessionary and inflationary gaps. The concept of stagflation, where inflation and low output occur simultaneously, is highlighted as a particularly challenging economic scenario. The paragraph also covers the long-run adjustment of the economy back to full employment following economic shocks, and the relationship between fiscal policy, the spending multiplier, and economic growth.
💹 Money, Banking, and Monetary Policy
This paragraph focuses on the nature and functions of money, differentiating between commodity and fiat money, and the roles of money as a medium of exchange, unit of account, and store of value. It explains the concept of M1 money supply and the practice of fractional reserve banking. The paragraph also covers the mechanics of bank balance sheets, required reserves, and the money multiplier. The role of the Federal Reserve in controlling the money supply through reserve requirements, the discount rate, and open market operations is detailed, as well as the impact of these tools on monetary policy, including expansionary and contractionary measures.
🌐 International Trade and Exchange Rates
The final paragraph discusses international trade and foreign exchange, starting with the balance of payments, which records all transactions between countries. It differentiates between the current account, which includes trade balances, investment income, and net transfers, and the financial account, which tracks financial assets. The concept of exchange rates and how they are influenced by supply and demand is explained, along with the impact of currency appreciation and depreciation on net exports. The paragraph also covers the factors that shift exchange rates, including tastes and preferences, income levels, and interest rates. It concludes with a discussion on floating versus fixed exchange rates and their implications for international trade.
Mindmap
Keywords
💡Scarcity
💡Opportunity Cost
💡Production Possibilities Curve (PPC)
💡Comparative Advantage
💡GDP (Gross Domestic Product)
💡Unemployment
💡Inflation
💡Aggregate Demand and Supply
💡Fiscal Policy
💡Monetary Policy
Highlights
Introduction to macroeconomics and AP宏观经济学 class overview
Scarcity and opportunity costs as fundamental economic concepts
Production Possibilities Curve (PPC) and its implications for efficiency and resource allocation
Comparative advantage and its role in international trade
Overview of economic systems: free market, capitalism, command economy, and mixed economy
The Circular Flow Model explaining interactions between businesses, individuals, and the government
Demand and supply fundamentals, including equilibrium and shifts
Macroeconomic measures: GDP, unemployment, and inflation as key indicators of economic health
Understanding GDP calculation, including expenditures and income approaches
The concept of nominal and real GDP, and the importance of adjusting for inflation
The business cycle and its phases: peak, recession, trough, and expansion
Unemployment types and measurements, including labor force participation rate
Inflation and deflation, and their impact on the economy and individual purchasing power
The Consumer Price Index (CPI) as a measure of inflation
The GDP deflator and its role in adjusting nominal GDP for inflation
The causes of inflation, including demand-pull, cost-push, and money supply issues
Aggregate demand and its determinants, including the wealth, interest rate, and foreign trade effects
Aggregate supply in the short and long run, and the concept of full employment GDP
Fiscal policy tools and their impact on the economy during recessions and expansions
The spending and tax multipliers, and their role in economic stimulation
Monetary policy and the Fed's control over the money supply and interest rates
The balance of payments, including current and financial accounts, and their significance in international trade
Foreign exchange rates, appreciation, and depreciation, and their effects on trade and investment
Floating and fixed exchange rate systems, and how they influence a country's currency value
Transcripts
hey econ students this is Jacob Clifford
welcome to ac/dc econ so in this quick
video I'm gonna cover everything you
need for an introductory macroeconomics
class or an AP macroeconomics class I'm
gonna go super fast but keep in mind
this is not designed to reteach you all
the concepts it's designed to help you
get ready right before you walk into the
big AP test your big final also it's a
great way to review what you know and
don't know by watching the entire class
over again you can spot the things that
you have to go back instead if you've
been watching my videos you know I sell
something called the ultimate review
pack it has a bunch of practice
questions and access to hidden videos to
help you learn economics these summary
videos they cover everything in greater
detail than this video I'm doing right
now now I was gonna make this video
available only to people who buy the
packet but then I thought you know I can
trust people man if you like my videos
if these videos help you learn economics
please go get the packet I'm gonna make
this video available to everyone but if
you like my stuff please support my
channel and help me continue to make
great econ videos okay let's start it up
now whether or not you're enrolled in a
microeconomics class or a macroeconomics
class it all starts the same for a basic
introductory econ course it's starting
the idea of scarcity scarcity ideas we
have unlimited wants and limited
resources also you learn the idea of
opportunity costs that's the idea that
everything has a cost or it doesn't
matter what you're producing you gotta
give up something to produce or any
decision you make has a cost
now those concepts come together with
the production possibilities curve it's
the first graph you learn in economics
it shows the different combinations of
producing two different goods using all
of your resources so any point on the
curve is efficient like you're using all
of your resources to the fullest any
point inside the curve is inefficient
and a point out here outside the curve
is impossible given your current
resources and there's two different
shapes you have to remember if it's a
straight line production possibilities
curve that means there's constant
opportunity costs which means the
resources to produce the different
products are very similar so similar
resources if it's a straight line if
it's a boat outline concave to the
origin that means that resources are not
very similar so when you produce more of
one to give the more and more of the
other one that's called the law of
increasing opportunity cost now this
curve can shift if you have more
resources like land labor and capital or
less resources or better technology that
can shift the curve another thing that
shifts a curve is train if another
country trades with another country that
can shift out their production
possibilities curve but it shows how
much they can consume not actually
produced so it doesn't actually change
how much you can
but you can consume beyond your
production possibilities curve and that
brings us to the hardest part of this
unit the idea of comparative advantage
compared advantage is the idea that
country should specialize in the product
where they have a lower opportunity cost
so if you're producing one thing and I'm
producing something else if I can
produce a lower opportunity cost than
you I should produce this you should
present a thing and then we should trade
now there's two different things gotta
remember absolute advantage and
comparative and absolute advantage is a
joke it's easy you just figure out who
produces more if that means they have an
absolute advantage compared advantage
requires you do some calculations or the
quick and dirty if you saw my unit
summary video and it tells you who
should specialize in what now another
thing you have to learn is that you have
terms of trade which means how many
units of one product should they trade
for the other product that wouldn't
benefit both countries that's the idea
of terms of trade in this unit you also
get a basic overview of different
economic systems like the free market
system capitalism and the idea of a
command economy and a mixed economy
we're gonna focus on capitalism in this
class and so you learn the circular flow
model the circular flow model shows you
that there's businesses and individuals
and the government and how they interact
with each other just remember businesses
both sell and buy two different things
they sell products and they buy
resources so there's a product market
and there's a resource market and
individuals you and me we buy products
and we sell our resources and the
government does some stuff as well
another thing you're going to learn here
is some vocab like transfer payments
this is when the government pays
individuals like welfare but it's not to
buy anything it's just to provide some
public service and you also learn the
idea of subsidies when the government
provides businesses money to produce
more and also you're going to talk about
the idea of factor payments so
individuals sell their resources and
businesses pay the factor payments to
those individuals unit one sets the
foundation for everything you're gonna
be doing later on you start with demand
and supply remember the man is a
downward sloping curve that shows you
the loved man when price goes up people
buy less and stuff right when price goes
down people buy more that's the idea
price and quantity demanded there's also
a lot of supply when the price goes up
people produce more price goes down
people produce less right price goes up
quantity supply goes up price goes down
client supply goes down now together
they formed equilibrium please note if
price goes up there is no shift price
does not shift the curve it just moves
along the curve creates either shortage
when the price is low or a surplus from
the price is higher you should also
understand
there's actual individual shifts so
there's only four things gonna happen
the man can go up the man can go down so
pi can go up or a supply can go down and
you just watch the graph draw the graph
tells you exactly happens the price in
quantity every single time now to
microeconomics class you got a lot more
details about the supply and demand
graph and ceilings and floors and all
sorts of crazy other stuff but you don't
need to understand those concepts for
most macroeconomics classes just
understand where equilibrium comes from
what happens when demand shifts right or
left when supply shifts left or right
and understand the idea of shortage and
surplus that's usually enough and you
add on to that concept when you learn
about a great demand
agar supply later on in unit 3 overall I
give unit one five out of ten difficulty
not because it's super hard because
there's a lot of stuff you got a cover
production possibilities curve supply
and demand
understand all these different graphs
and it's gonna set the foundation for
everything you do in the rest of the
course here we go now we're going to
jump into full macroeconomics we talk
about the macro measures in unit two
were talking about the three goals of
every economy doesn't matter what kind
of economy is they have three goals they
want to grow over time they want to
produce more stuff they want to keep
unemployment down like limit
unemployment they want to limit
inflation or at least keep prices stable
that's what you do in the student you
cover each one of these concepts how do
you measure these different things and
one of the issues with those
measurements and then we move on and ply
that stuff in later units so it starts
off with the idea of growth growth is
the idea the economy's expanding over
time and the most important concept
probably in the entire course is GDP
gross domestic product it's the dollar
value of all final goods produce in a
year in a country's border so anything
you produce in your own country now you
should also understand the idea of GDP
per capita which is the GDP divided by
population and get good at doing percent
change so if I say the GDP in one year
is this amount in the GDP in another
year it's different amounts you should
be able to calculate the percent change
in the GDP and when it comes to GDP it's
important to know it's not included in
GDP and the first one is intermediate
goods these are goods that go into the
production of a final good so we only
count the final good not the things that
went into producing it so we count the
final laptop not the computer chip that
the laptop producer bought from another
company so intermediate goods don't
count also we don't count non production
transactions these are situations where
newest producer stocks and bonds they
don't count in GDP because we have to
count things that are goods and services
provided in that year nothing old
nothing counted in previous years that
doesn't count towards GDP and the last
one is non market transaction so illegal
goods or illegal labor those don't count
in GDP either there's two ways to
calculate GDP even though the most
important one for our purposes is
usually the expenditures approach but
there's also the into approach the
expenditure approach adds up all the
spending on all goods and services in
the economy and that tells you how much
we produce in a given year the income
approach adds up all the income earned
from producing those final goods and
services so really it should just be the
same number two different ways of
calculating it but it does give us the
most important equations remember GDP
equals C plus I plus G + xn the super
important concept remember business
spending is investment it's not stocks
and bonds stocks and bonds don't count
towards GDP government spending
government can buy stuff and other
countries can buy stuff now for net
exports remember exports - imports is
the net exports in three united states
actually a negative number and the
income approach also has its own
equation it's made up of rent wages
interest and profits so if you add up
all those you adds up what's called the
factor payments then that should add up
to the GDP of the things we produce in a
year another concept you're gonna see is
the idea of nominal and real GDP
remember nominal GDP is not adjusted for
inflation so when we talk about the
economy we're usually analyzing real GDP
because that's suggesting for inflation
and showing us what we're actually
producing and a great way to show that
is the business cycle the business cycle
shows you there's four different phases
in the business cycle when there's a
peak and then when the economy is up
there eventually over time the economy
moves towards a recession and it falls
down to a trough and then it goes into
expansion and goes right back up economy
goes up and down over time and that
tells you there's only three places the
economy can be at any given period of
time we can be at full employment this
the idea that the country is doing great
GP is real GP is moving nice and steady
we can have a recession right this is a
no recessionary gap or the economy is
not doing well we have very high
unemployment and we have something
called an inflationary gap when the
economy is kind of overheating and we're
having more and more inflation you're
gonna see those concepts later on as
well and that leads to the second goal
of every economy to limit unemployment
unemployment is the idea people who are
looking for work that can't find it who
are in the labor force remember it's not
by population it's the number of people
who are not working who are actively
looking divided by the labor force times
100 gives you percentage that percentage
number people who are unemployed in the
economy there's also the labor force
participation rate and understand the
idea of labor force is the group of
people who can and are able and are
willing to work above 16 not
institutionalize not in jail and at this
point you're to learn that's three types
of unemployment there's frictional when
people are between jobs and they're
looking for jobs they're structural when
people are replaced by robots or they
don't have the skills that people
actually want or that employers want so
their skills are obsolete and they're
cyclical unemployment when there's a
recession that kind of has gone down and
people have lost a job because no one's
buying products so people don't need
resources they don't need the workers so
anytime in the economy whether it's good
or bad there's always gonna be two types
of unemployment frictional and
structural and that's the goal remember
the goal is not to have 0% unemployment
the goal is to have just frictional and
structural unemployment so in United
States that's about you know five
percent unemployment that's called the
natural rate of unemployment it's
perfectly great to have only frictional
and structural unemployment if the
economy is doing poorly we have a
recessionary gap when we also have
cyclical unemployment and of course the
unemployment rate also has some
criticisms keep in mind that sometimes
people aren't counted when they should
be kind of it's called discouraged
workers these are people who stopped
looking for work and they're not counted
in the labor force they're not
considered unemployed but in real life
like they are they wish they had job but
they stopped looking we stop looking
you're not part of labor force so that
one makes the unemployment rate look
lower than it actually should be and
there's also the idea of part-time
workers pipeline workers are counted as
fully employed and so somebody might be
all upset and sad that they're not
working full-time but according to the
numbers they're still considered fully
employed and again the unemployment rate
number is that perfect doesn't show
actually what's happening in all
situations in the economy and there's
one more goal of every economy to keep
prices stable to limit crazy inflation
remember inflation is the idea that
money loses its purchasing power right
so it requires more money to buy the
same number of goods as before when
there's more inflation we have inflation
there's also deflation when prices are
falling and this inflation wins the
economy or sorry when the inflation
rates actually falling so inflation
rates
going up for a long time and the
inflation rates going up by less and
less that's called this inflation you
should understand the idea of nominal
and real wages if you know let's say
your boss gave you a five percent raise
yeah great
my nominal wage increase my nominal wage
went up by five percent but if you have
ten percent inflation than in real life
your real wage fell by five percent so
you have to understand the idea that you
know nominal is just looking at the
regular numbers and then real adjust for
inflation it's the same thing with
interest rates if inflation goes up
that's going to decrease the real
interest rate right that's the idea of
you know unexpected inflation which
hurts
lenders unexpected inflation hurts
lenders it helps borrowers another
country we have to understand is the
idea of CPI it's the Consumer Price
Index it's the best way and the most
popular way we show it of measure you
know prices changes over time and
inflation basically it's a market basket
that we can analyze and there's an
equation you got to know the market
basket of the year you're looking for
the value of the goods that we analyze
and track the market basket divided by
that same goods and same stuff in a base
year so what was the value is that price
of all that stuff in the base year times
100 and it pops at a number and that
number tells you how prices have changed
since the base year so if you see a 120
prices went up 20% since the base here
if you see a 200 prices went up 100%
since the base year you see it 95 that
means prices fell 5% since the base year
probably one of the hardest concepts in
this unit is the idea of the deflator
the deflator conceptually is really easy
it's like the CPI except it analyzes
everything so instead of just consumer
goods it's analyzing you know steel and
concrete and other things that consumers
don't really buy but the business would
buy the government buys and it looks at
the prices of everything in the economy
so the deflator deflates the nominal GDP
the equations right here the GDP
deflator is the nominal GDP divided by
the real GDP times 100 again it's a
number it's an index number that tells
you how prices changed relative to some
base year you definitely wanna do some
calculation and some practice on doing
the deflator and the last concept you're
gonna learn in this unit is the causes
of inflation inflation happens for three
reasons the first one is when a
government just prints too much money
and you learn something called the
quantity theory of money it's an
identity that shows
you times V equals P times y now what
does that mean
and there's amount of money in the money
supply V is the velocity of money it's
how much time money is spent in how many
times money is spent and Reis pence in a
given period of time P is the prices of
everything and Y is the amount of stuff
we're actually producing so P times y is
the nominal GDP so this has this Kennedy
says the amount of money that's out
there times how many times people spend
that money over and over again
equals the nominal GDP now it's
important because it shows you when you
increase the money supply and velocity
stays the same and why the output stays
the same you have an equivalent change
in prices so if I know money supply goes
up by ten percent price is gonna go up
exactly by ten percent and the other two
causes of inflation are actually super
simple the first ones called demand pull
this is the idea of demand goes up
people want to buy a lot more stuff in
your country and people put up the price
for it so demand pulls up prices the
other one is called cost push cost
pushes the idea that there's some
resource costs or you know we ran out of
some key resource to produce stuff that
cost the production costs to rice so now
it costs more to produce stuff so we
produce less stuff causing prices to go
up
so either demand goes up people want
more stuff or you can't produce as much
stuff either one causes prices to go up
causes of inflation overall unit two is
not that difficult I give it four out of
ten difficulty but the concepts you
actually have to know you have to
understand the types of unemployment GDP
I mean he's huge concepts that if you
don't get these you're not gonna get
future concepts at all now in unit three
this where things get hard it's a bear
of unit there's so much stuff you got to
learn it starts off with the idea of a
great demand aggregate demand is all the
stuff that people want to buy in the
economy at different price levels and
it's kind of downward sloping demand
curve just like a market demand curve
except now instead of price it's price
level it's the price level and the
quantity demanded of everything bought
by everybody now this is downward
sloping for three reasons you need to
understand the three reasons first is
the wealth effect the idea that when
price level goes up the assets and
people's banks are worth less right now
I can't buy as much as before
and so when price level goes up people
buy less stuff and the opposite as well
price level goes down people buy more
stuff there's also the interest rate
effect when inflation happens interest
rates tend to go up and so people would
take out less loans again
these are the reasons why that a great
demand curve is downward-sloping
the last reason is because the foreign
trade effect this is the idea that when
price level goes up people from other
countries don't want to buy your stuff
and so quite a bit again goes down just
like a market demand curve the aggregate
man curve can shift and increases the
right a decrease to left and the
shifters are really simple anything that
changes what people want to buy so if
other countries or if there's more
investment or if there's more consumer
spending any of those things can shift
the aggregate demand either right or
left there's also an aggregate supply
curve which is upward sloping in the
short run
that means when price level goes up
producers want to produce more stuff but
there's also a long-run graph this is
the idea of you know in the long run
will produce the same exact quantity
that's the idea of full employment GDP
and the long-run aggregate supply shows
you there's no relationship between
price level and the real GDP we're
actually producing in the long run in
other words when in the long run
eventually prices will go up or down and
we'll still produce the same s stuff
that we did before in the long run now
both the short run aggregate supply and
the longer tech supply can shift the
short-run of course shifts right if it's
an increase a left of this decrease
anything that affects producers here so
price of resources can do this
technology can do this some sort of
government regulations or taxes or
subsidies that affects a lot of
producers that could ship the short max
supply curve this is by far the most
important graph need be able to draw
showing full employment showing a
recessionary gap is showing an
inflationary gap this shows the same
concept we saw in the last unit on the
business cycle another key concept to
watch out for is the idea of stagflation
when Agri supply shifts to the left
price level goes up quantity goes down
and this is like the worst case scenario
we have inflation and low output which
is bad now another thing you have to be
able to do here is show what happens in
the long run in other words when there's
an event that occurs how do you go from
the short run back to the long run if
consumers want more stuff Agata man goes
up right that leads to an inflationary
gap but in the long run wages will go up
cost the firm's will go up and the short
night supply will shift back to the left
and put us back in the long run it goes
the same way for recessionary gap assume
the economy's at full employment
if consumption goes down people buy less
stuff we end up with a recessionary gap
and what happens well if wages are
flexible which is debatable if wages are
flexible eventually prices will fall for
resources wages will fall and then cost
will fall for firms so firms can produce
more Eiger supply shifts right boom
right back to the long-run that's
creating the long-run aggregate supply
curve that long-run adjustment is
different than economic growth economic
growth is the idea of GDP going up in
the long run other words when there's an
increase in investment there'd be more
capital so a great demand will shift to
the right and since we can produce more
stuff short black supply would shift the
right and the long-run Agra supply would
also shift to the right and you've seen
this before with the production
possibilities curve the production
possibilities curve shifting to the
right is like the long-run aggregate
supply curve shift ins right we can
produce more stuff that we couldn't
produce before that's economic growth
before you get too excited that you can
draw the concepts on one graph keep in
mind there's another graph if the bills
show recessionary gap inflationary gap
in a full employment it's called the
phillips curve the phillips curve shows
the relationship between inflation and
unemployment in the short-run there's a
downward sloping relationship in other
words a negative relationship between
these two things either you get a high
inflation or you know high unemployment
but you usually don't have them at the
same time and in the long run its
vertical there's no relationship between
inflation and unemployment in the long
run so with these two graphs you should
be able to show when the economy's at
full employment when has an inflationary
gap when it has a recessionary gap or
when there's a shift in the short-run at
supply curve and how that shifts these
short run Phillips curve the next thing
you're gonna learn in this unit is the
idea of fiscal policy which is the
change in government spending and taxes
when the economy is doing poorly
how do we fix the economy expansion airy
fiscal policy is when we increase
government spending or cut taxes and
there's contractionary fiscal policy
where you increase taxes or decrease
government spending and we're the last
concepts you're going to see is the
spending multiplier spending multipliers
the idea when people spend that become
somebody else's income and then people
save a portion of that and they spend
the rest and that's spending become
somebody else as income keeps happening
over and over again you understand the
idea of the marginal propensity to
consume which shows you how much people
consume of new income and then there's
much plenty to say which is the opposite
side how much people save of new income
simple spending multiplier is won over
the marginal propensity to save which
means this is if initial change in
spending happens that's going to get
multiplied by this amount and
the total change in spending after
people spending saves Benna save what
happens over and over and over again
right there's also a tax multiplier
which is one less than the spending
multiplier and then the math isn't super
difficult it's just something at the
practice to get comfortable with the
last thing in this unit is the idea of
the debts the problems of fiscal policy
right increasing government spending and
lowering taxes seems like a good idea
but you're gonna have to deficit spend
which is spend more than you bring in in
tax revenue so the government's gonna
spend more than they bring in and tax
revenue means they have to go into debt
or they have to have a deficit for that
given year now the debt is the
accumulation of all the deficits the
deficit is amount that they're
overspending in that given year and you
should understand this idea of crowding
out when the government does a lot of
borrowing that increases interest rates
and kind of crowds out investors and
consumers from taking out loans and
buying more stuff now this unit I'm
gonna give eight out of ten difficulty
because it has a bunch of key grass a
bunch of key concepts maybe get slowed
down we talked about the multiplier but
none of it's like super impossible hard
but it's a lot of stuff going on it's
the bulk of a macro economics class okay
here we go we're talking about money it
starts off by talking about what money
is it's a mean of exchange and why it's
better than the barter system then you
talk about commodity money and fiat
money commodity money has some sort of
intrinsic value fiat money does not and
the three functions of money there are
the medium of exchange Univ account and
a store of value the next in you talking
about is m1 money supply so we talk
about money in this class we're not just
talking about money and currency and
cash we're talking about money in people
checking accounts so demand deposits as
well also understand the idea of the
fractional reserve banking the idea that
banks hold a portion of reserves and
they loan out the rest the money that
ends up you know being spent by somebody
and that ends up in another bank and
that other bank holds a portion that
money in loans the rest of it Out's
you also understand the idea of bank
balance sheets bank balance sheet shows
the assets and liabilities for a given
bank you should be able to use this to
calculate the required reserve ratio the
excess reserves required reserves is the
amount of money that a bank has to hold
by law
excess reserves there's not money they
can loan out if they want to at this
point you're also going to learn about
the money multiplier we learned about
the spending multiplier in unit 3 now
it's the same idea except talking about
spending and you know consuming and
saving or talked about banks lending so
when a bank lends money someone takes
the money spends it ends up in another
Bank
that bank holds a portion and then loans
the rest out that keeps happening over
and over and over again the multiplier
for the money multiplier is right here
one over the reserve requirement
remember the spending multiplier was one
over the marginal pensee to save the
money multiplier one over the reserve
requirement same concept though the
initial change in money supply times
multiplier shows you the total change in
the money supply key graph in this unit
is the money market graph it shows a
supply and demand for money
you've got interest rates you got the
quantity money it's got a downward
sloping demand demand for money it
happens for two reasons transaction
demand and asset demand people need you
know money to buy stuff and they need
money or they like to have their assets
and money as opposed to have their
assets and bonds or stocks or something
that's not money so there's a demand for
money the supply is vertical it's set by
the Fed and that comes together and sets
the nominal interest rate now the Fed
can control that money supply they could
increase it shift to the right and they
lower the interest rate or they can
decrease it shift it to the left and
they can increase the interest rate
that's called
monetary policy remember the Fed
controls money supply if they increase
the money supply lowers interest rates
which would increase investment and
consumer spending people take out more
loans buy more stuff it would increase
aggregate
that's called expansionary monetary
policy if the Fed were decreasing the
money supply that would increase
interest rates decrease investment
decrease consumer spending people take
out less loans because it's more
expensive to pay back the loan and that
would decrease the higher demand that's
called contractionary monetary policy
but understanding that is not enough you
have to understand how they shift the
money supply there's three shifters
reserve requirement the discount rate
and open market operations the reserve
requirement the Fed can decide to choose
whether to increase or decrease the
amount that banks have to hold discount
rate is how much banks are charged by
the Fed when they borrow money from the
Fed and then open micro operations when
the Fed buys or sells bonds here's the
rules you gonna watch out for it shows
you what happens when the reserve
requirement goes up or down discount
rate goes up or down and then the Fed
buys or sells bonds to the money supply
so make sure you memorize this you got
to know this that right there is
monetary policy keep in mind there's a
difference between the discount rate is
what the Fed charges banks and the
federal funds rate is what banks charge
each other so if a bank needs money they
can either go they first they can go
to the people they know lent the money
to and say I will need the money back
that's one option or they can go to
another bank or the may and go to the
Fed so when they go to the Fed that's a
discount rate that's what they're
charged they go to another bank that's
called the federal funds rate the names
horrible they should be reversed right
but just remember if federal funds rate
is what banks charge other banks the
next concept you have to understand is
the idea of loanable funds loanable
funds is another key graph that shows a
demand and the supply of loans the
demand for loans is by borrowers you the
people who want to borrow money the
supply is by lenders all the people who
want to lend out money and it gives you
the real interest rate now this curve of
course can shift both supply or demand
for example the government does a lot of
borrowing that increases the demand for
loans because the Khmers say i want to
borrow some that and again interest
rates go out then the graph shows you
the concept of crowding out which I
talked about earlier if the government
deficits bends they demand more money
that increases demand for loans higher
interest rate higher real estate means
less investment and less consumption of
you know things that people would pick
out loans for so overall unit four is
pretty hard I give it eight out of ten
difficulty because it has some graphs
and it has some calculation so as to
bring a lot of different concepts
together but it's all talking about one
big concept monetary policy if you get
that you're gonna be fine now for the
last unit we talked about international
trade and foreign exchange it's gonna
start off the balance of payments this
shows all the transactions between
different countries it has two different
accounts the current accounts and the
financial account the current account is
made up of first the balance of trade
that's the first idea on understand
exports and imports if you export more
than you import then you have a trade
surplus if you import more than you
export you've a trade deficit so the
first part that you need to understand
is the goods and services that are sold
are sold and kept track of in the
current account now investment income is
also counted in the current account and
so is net transfers when one country you
know gives aid to another country or
remittance when one person in one
country lives there they send money back
to their family these things all count
in the current account the financial
account is basically financial assets it
shows inflow and outflow of money coming
in or out of a country now if the inflow
into your country is greater than the
outflow that means you have a surplus in
financial account if outflow is more
than the inflow then you have a deficit
in the financial account now keep in
mind when a country has a deficit in the
current account that means they have to
have a surplus in the financial account
that's why it's got the balance of
payment the next times that you're gonna
learn is the big concept in this unit
foreign exchange it talks about the
relative value of currencies to each
other now the first thing I understand
is the idea of appreciation of this is
the idea that a country's currency
increases in value relative to other
countries currency and the opposite is
the idea of depreciation now keep in
mind the relationship between
appreciation depreciation and net
exports when your current country's
currency appreciates that's gonna cause
your net exports of that country to fall
people can buy less your stuff because
it's more expensive to buy your stuff
when your currency depreciates that's
gonna cause the net exports to go up so
don't get confusing all depreciation is
a bad thing it's not it's actually great
if you're an exporter it's bad if you're
an importer also understand that there's
a graph here it looks like this this
shows you the supply and demand for
dollars relative to euros so be able to
draw the demand supply keep in mind the
demand is buy because we're analyzing
dollars here the demand is by Europeans
and the supply is by Americans also
understand that when there's a change in
one market there's a change in a
corresponding other market in other
words this is the man for dollars and
the supply for dollars there's also the
supply and demand for euros and it's the
exchange rate so for example Europeans
want to go on vacation in the United
States they need more American dollars
so the demand for dollars increases and
the dollar is going to appreciate
relative to the euro but at the same
time Europeans are going to supply more
of their euros that causes the euro to
depreciate so keep in mind for any graph
there's also a phantom graph that goes
along with it and the rule is when
demand goes up for one the other country
has to supply more of theirs also there
are four shifters of foreign exchange
the first one is the one we just did
tastes and preferences of people prefer
more things from one country then
they're gonna demand more of that
currency so they can go buy it so that
will cause that currency to appreciate
so tastes the premise is really easy
next one is income if a country is
richer they buy more things including
things from other countries then there's
inflation so if price level goes with my
country I don't want to
stuff in my country more at this higher
price I go by other country stuff and
last one is interest rates which gets
tricky interest rates are now the
opposite of what you'd normally thoughts
all the way back in unit 3 and unit 4
now we talk about interest rates we're
saying that interest is a good thing
right in other words interest rates
higher interest rates will bring in more
inflow in your country because other
countries want to get the higher rate of
return keep in mind two currencies can't
appreciate relative to each other at the
same time so the dollar can't appreciate
relative to the euro as the euro
appreciates relative dollar one goes up
and the other one has to go down last
thing here is the idea of floating and
it's a fixed exchange rates floating
exchange rates allow supply and demand
to set the exchange rate a fixed
exchange rate is when the government of
the country tries to manipulate their
currency to keep it fixed or pegged to
another country's currency now unit 5 is
super short and it doesn't have a lot of
graphs but I give it a six out of ten
difficulty because it's just so darn
important you have to understand how to
get exchange rates and don't get it
tripped up when you're analyzing two
different countries and whether the
currency appreciates or depreciates hey
thank you so much for watching this
video I wish you all the best of luck on
AP test or on your big final exam hey
you're gonna do awesome okay thanks
watching Telex time
5.0 / 5 (0 votes)