Solve a Linear System by Graphing | jensenmath.ca | grade 10
Summary
TLDRThis video script introduces the concept of solving linear systems in a grade 10 math course. It defines a linear system as two or more linear equations considered together and explains the importance of finding the point of intersection. The script outlines three methods to solve these systems: graphing, substitution, and elimination, focusing on the graphing method in this lesson. It demonstrates how to rearrange equations into slope-intercept form, graph the lines, and find their intersection points. The video also discusses the possible outcomes of solving linear systems, including one solution, no solution, or infinite solutions, and emphasizes the importance of verifying solutions.
Takeaways
- 📚 The lesson is focused on solving linear systems, which are sets of two or more linear equations considered simultaneously.
- 📈 A linear system is solved by finding the point of intersection where two or more lines cross, graphically represented as the values of x and y that satisfy all equations.
- 📊 There are three main methods for solving linear systems: graphing, substitution, and elimination, with the first lesson covering graphing.
- 📉 To graph lines, equations are rearranged into the slope-intercept form \( y = mx + b \), where m is the slope and b is the y-intercept.
- 📐 The slope of a line is calculated using the formula \( \frac{change\ in\ y}{change\ in\ x} \) or \( \frac{y2 - y1}{x2 - x1} \).
- 🔍 When graphing, one can use the slope and y-intercept, x and y intercepts, or a table of values to plot the lines accurately.
- 🤔 There are three possible outcomes when solving a linear system: one solution (lines intersect), no solution (parallel and distinct lines), or infinitely many solutions (parallel and coincident lines).
- 📝 The process of solving by graphing involves plotting both lines, finding their point of intersection, and verifying the solution by substituting the intersection point into the original equations.
- 🔢 The script provides step-by-step examples of graphing lines and finding their points of intersection, emphasizing the importance of clear communication and verification of the solution.
- 📉 The importance of verifying the solution is highlighted to ensure the intersection point satisfies both equations in the system, confirming its accuracy.
- 🚫 The script also discusses scenarios where the lines do not intersect, such as when they are parallel and distinct, resulting in no solution, or when they are parallel and coincident, resulting in infinitely many solutions.
Q & A
What is the main focus of the first unit of the grade 10 math course?
-The main focus of the first unit of the grade 10 math course is solving linear systems.
What is a linear system in mathematics?
-A linear system is a set of two or more linear equations that are considered at the same time.
What is the definition of the point of intersection in the context of linear systems?
-The point of intersection is the point where two or more lines cross, which is the solution to the linear system when solved graphically.
What are the three main methods for solving a linear system mentioned in the script?
-The three main methods for solving a linear system are graphing, substitution, and elimination.
How does the script define 'solving' a linear system?
-Solving a linear system means finding the values of the variables that satisfy all of the equations in the system.
What is the equation in the form of y equals mx plus b used for?
-The equation y equals mx plus b is used to describe the relationship between the x and y coordinates of any point on a line segment in terms of the slope (m) and the y-intercept (b).
How can the slope of a line be calculated according to the script?
-The slope of a line can be calculated using the slope formula, which is the change in y over the change in x, written as (y2 - y1) / (x2 - x1).
What are the possible outcomes when solving a linear system graphically?
-The possible outcomes are one solution (if the lines intersect at one point), no solution (if the lines are parallel and distinct), or infinitely many solutions (if the lines are parallel and coincident).
Why is it important to verify the solution after finding the point of intersection?
-It is important to verify the solution by plugging the x and y values of the point of intersection into both original equations to ensure that the point satisfies both equations, confirming it is the correct solution to the linear system.
How does the script describe the process of graphing lines using the slope and y-intercept method?
-The script describes the process as rearranging the linear equations into the form y equals mx plus b, then using the slope (m) and y-intercept (b) to plot the y-intercept and additional points using the slope to fill the grid, and finally connecting the points with a straight line.
What is the significance of the y-intercept in the context of graphing lines?
-The y-intercept is the point where the line crosses the y-axis, and it is used in conjunction with the slope to accurately graph the line.
How can you determine if two lines are parallel?
-Two lines are parallel if they have the same slope but different y-intercepts.
What does it mean if two lines are coincident?
-If two lines are coincident, it means they have the same slope and y-intercept, and therefore, they lie exactly on top of each other, indicating an infinite number of solutions to the linear system.
How does the script suggest communicating the solution to a linear system?
-The script suggests communicating the solution clearly, either by stating the point of intersection as an (x, y) coordinate or by stating the values of x and y separately, and ensuring the solution is well-organized and easy for the teacher to identify.
Outlines

This section is available to paid users only. Please upgrade to access this part.
Upgrade NowMindmap

This section is available to paid users only. Please upgrade to access this part.
Upgrade NowKeywords

This section is available to paid users only. Please upgrade to access this part.
Upgrade NowHighlights

This section is available to paid users only. Please upgrade to access this part.
Upgrade NowTranscripts

This section is available to paid users only. Please upgrade to access this part.
Upgrade NowBrowse More Related Video
ALL OF GRADE 11 MATH IN 1 HOUR! (exam review part 1) | jensenmath.ca

ART TEACHES MATHEMATICS IN THE MODERN WORLD-LESSON 1: INTRO TO LINEAR PROGRAMMING
Pembahasan Buku PR Matematika Kelas XB Intan Pariwara|Asesmen 2 Pilihan Ganda No.1-10|Kurmer
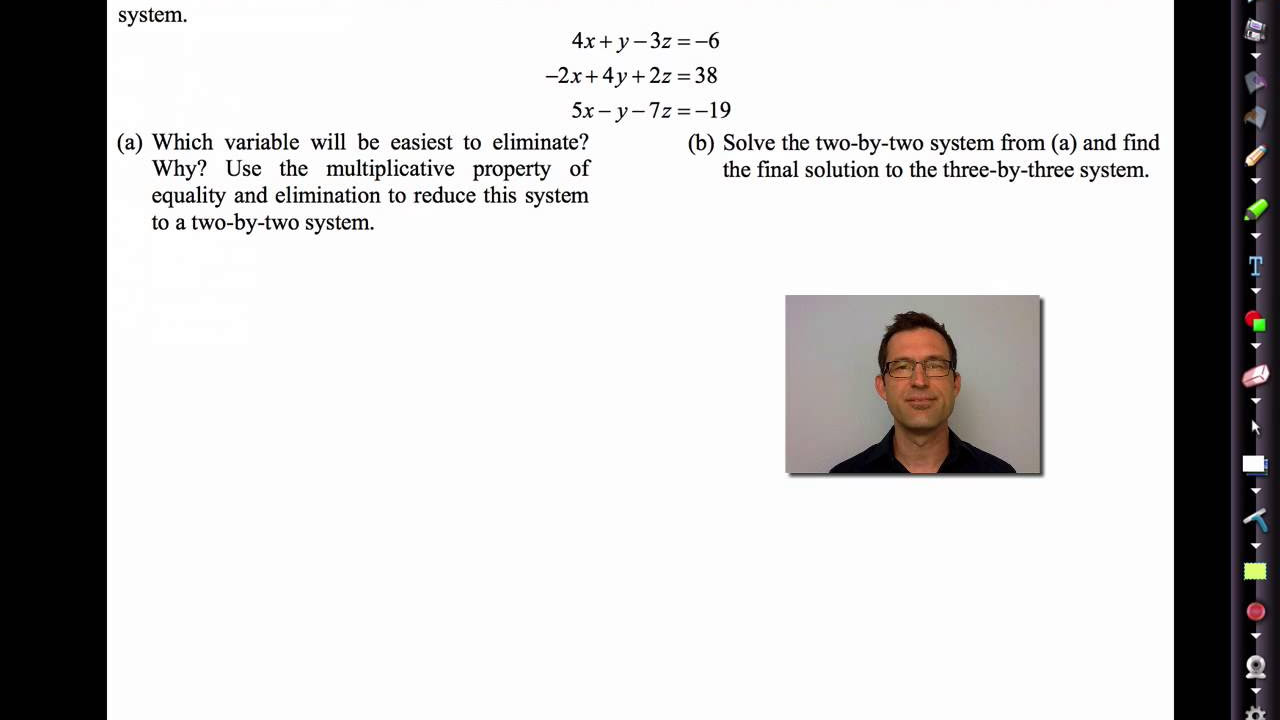
Common Core Algebra II.Unit 3.Lesson 7.Systems of Linear Equations
METODE NUMERIK P2 | METODE GAUSS UNTUK MENYELESAIKAN SPL

Materi Matematika Kelas 8 : Sistem Persamaan Linear Dua Variabel (SPLDV)
5.0 / 5 (0 votes)