+$11k using Volume Profile - Is it better than VWAP?
Summary
TLDRIn this educational episode, Ross Cameron, a seasoned full-time trader, offers an in-depth tutorial on utilizing the volume profile indicator for technical analysis in trading. He explains the concept, its importance in gauging market sentiment, and how it can be used alongside the volume-weighted average price (VWAP) for better trading decisions. Ross shares his personal trading experiences, including a detailed walkthrough of his wins and losses, to illustrate the practical application of the volume profile in real-time trading scenarios.
Takeaways
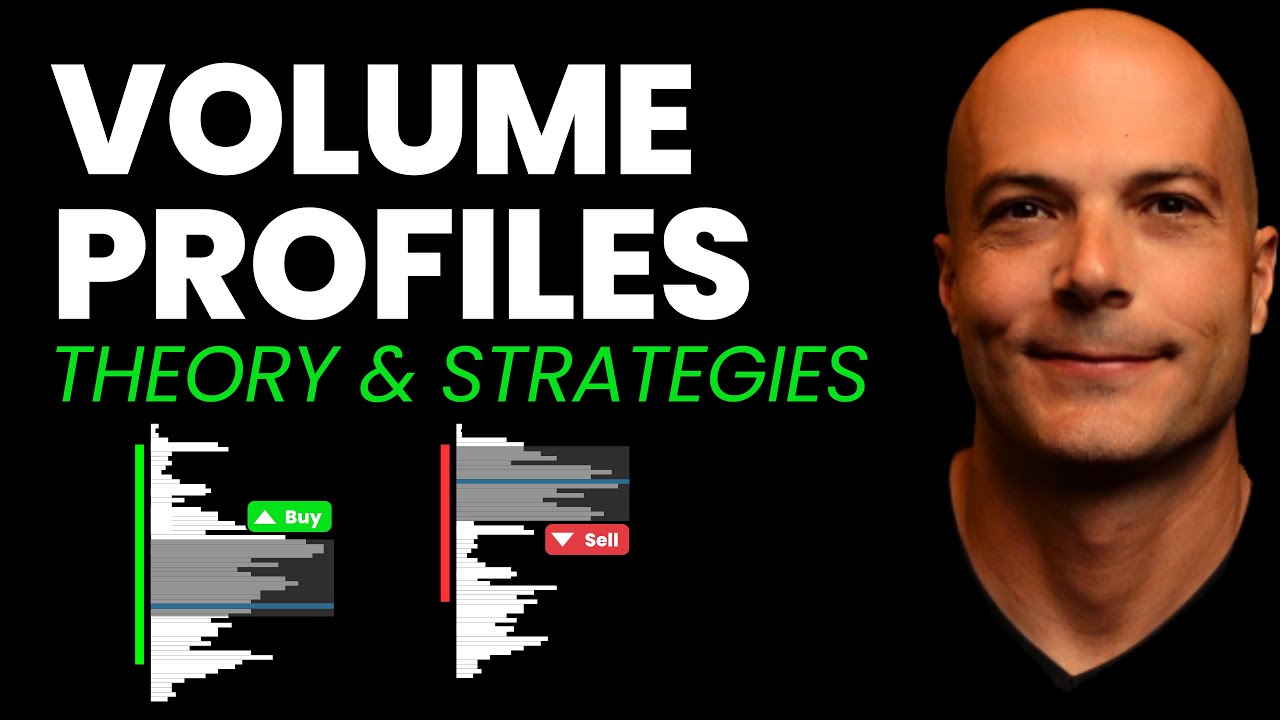
- 📈 The volume profile indicator is a technical tool used in trading to analyze trading volume at different price levels and identify the point of control (POC), which is a key price level where the most volume occurs.
- 🏁 When trading above the POC, bulls are in control, and when below, bears dominate, making the POC a crucial level for support, resistance, and crossovers.
- 👨🏫 Ross Cameron, a full-time trader with over a decade of experience, shares his insights and strategies, emphasizing the importance of real, audited profits over social media claims.
- 📊 Volume profile differs from volume-weighted average price (VWAP) in that it represents pure volume distribution across price rather than a moving average of price with volume factored in.
- ⚠️ The point of control can act as a pivot or trigger level, indicating potential shifts in sentiment when the price crosses this level.
- 📉 Ross experienced a challenging day with significant losses on certain trades, highlighting the risks and volatility inherent in trading.
- 📈 Ross's profitable trades on stocks like Lipo and Pali demonstrate the effectiveness of using volume profile in conjunction with other indicators like VWAP and MACD for entry and exit decisions.
- 🔍 Volume profile settings such as value area volume, row size, and volume up versus down can be adjusted to fit different trading styles and preferences.
- 📊 The indicator is primarily used on intraday charts, with Ross preferring the 5-minute chart over the 1-minute to avoid inaccuracies due to zoom level.
- 📉 Ross's losses on stocks like BMR and LR underscore the importance of risk management and the need to take profits when available rather than over-relying on potential big gains.
- 💰 Despite a day of mixed results, Ross finished with a net profit, emphasizing the importance of consistent strategy and learning from both wins and losses in trading.
Q & A
What is the main topic of the video?
-The main topic of the video is teaching how to use the volume profile indicator in technical analysis for trading stocks, cryptocurrencies, and other financial instruments.
What is a volume profile and why is it important in trading?
-A volume profile is a technical indicator that analyzes the volume occurring at different prices, showing where the most volume is taking place. It is important because it helps traders understand the point of control, which can indicate bullish or bearish sentiment and potential support and resistance levels.
What does the point of control (POC) represent in the volume profile?
-The point of control (POC) represents the price at which the highest volume of shares has been exchanged. It serves as a key indicator of potential support or resistance and can signal a shift in market sentiment when crossed.
How does Ross Cameron use the volume profile in his trading?
-Ross Cameron uses the volume profile as an intraday indicator primarily on the 5-minute chart to identify areas of high volume and potential changes in trend or support and resistance levels.
What are the standard settings for the volume profile indicator according to Ross Cameron?
-The standard settings for the volume profile indicator that Ross Cameron uses include a value area volume of 70, row size of 24, and volume up versus down settings.
How does the volume profile differ from the volume weighted average price (VWAP)?
-While VWAP is a moving average that lags behind price, the volume profile adjusts more rapidly to high levels of volume, providing a more immediate reflection of the point of control and areas of significant buying or selling pressure.
What is the significance of the point of control line's movement in relation to the stock's price?
-The movement of the point of control line indicates where the majority of trading activity is happening. If the stock's price is consistently above the point of control, it suggests a bullish trend, whereas if it's below, it indicates a bearish trend.
What is the role of volume in the context of the volume profile indicator?
-Volume plays a crucial role as it reports the number of shares traded at different prices, not just at different times. It helps in identifying the point of control and understanding the intensity of buying or selling at specific price levels.
How does Ross Cameron define a pivot or trigger in the context of trading?
-A pivot or trigger is a specific price level where a significant price movement or high volume is expected to occur. It acts as a critical level of support or resistance, and breaking this level can lead to a significant market reaction.
What is the importance of the volume profile indicator in identifying potential areas of support and resistance?
-The volume profile indicator is important because it shows the distribution of volume across different price levels, making it easier to identify areas that may act as support or resistance due to high trading activity at those levels.
How does Ross Cameron approach trading when the price is between the point of control and VWAP?
-When the price is between the point of control and VWAP, Ross Cameron exercises caution as this indicates a potential tug-of-war between buyers and sellers. He looks for the price to break out and hold above the point of control for a bullish signal or below it for a bearish signal.
What is the significance of the volume profile in Ross Cameron's daily trading routine?
-The volume profile is significant in Ross Cameron's daily trading routine as it helps him identify key support and resistance levels, understand market sentiment, and make informed decisions about when to enter or exit trades.
Outlines

This section is available to paid users only. Please upgrade to access this part.
Upgrade NowMindmap

This section is available to paid users only. Please upgrade to access this part.
Upgrade NowKeywords

This section is available to paid users only. Please upgrade to access this part.
Upgrade NowHighlights

This section is available to paid users only. Please upgrade to access this part.
Upgrade NowTranscripts

This section is available to paid users only. Please upgrade to access this part.
Upgrade NowBrowse More Related Video
The MOST POWERFUL Day Trading Indicator
Trade Mentor - Part 4 - Technical Analysis

I traded like Ross Cameron for 1 day and here’s what happened…

Secret Volume Trading Strategy VRPR | How To Trade Volume Profile

Trade with Institutional Tools: Part 1 ( In English)
Backtest Trading Gold (XAUUSD) Winrate 80% - 90% No Gimmick & No Hoax | Swing Trading | Day Trading
5.0 / 5 (0 votes)