The Effects of Outliers on Spread and Centre (1.5)
Summary
TLDRThis video script delves into the impact of outliers on statistical measures of spread and center. Outliers, defined as data points that are significantly distant from the rest of the dataset, can skew the mean, but have less influence on the median and mode. The script illustrates this with an example of temperature data, showing how excluding an outlier like -350°C from Winnipeg's July 1st readings adjusts the mean from -28°C to 25.667°C. It also explains that while the median and mode remain unaffected, the range and standard deviation are highly sensitive to outliers, as they can drastically alter the maximum and minimum values.
Takeaways
- 📊 The script discusses the impact of outliers on statistical measures such as spread and center, defining outliers as data points that are numerically distant from the rest of the dataset.
- 🔍 Outliers can be either the largest or smallest values in a dataset, causing them to stand out from the main pattern of data points.
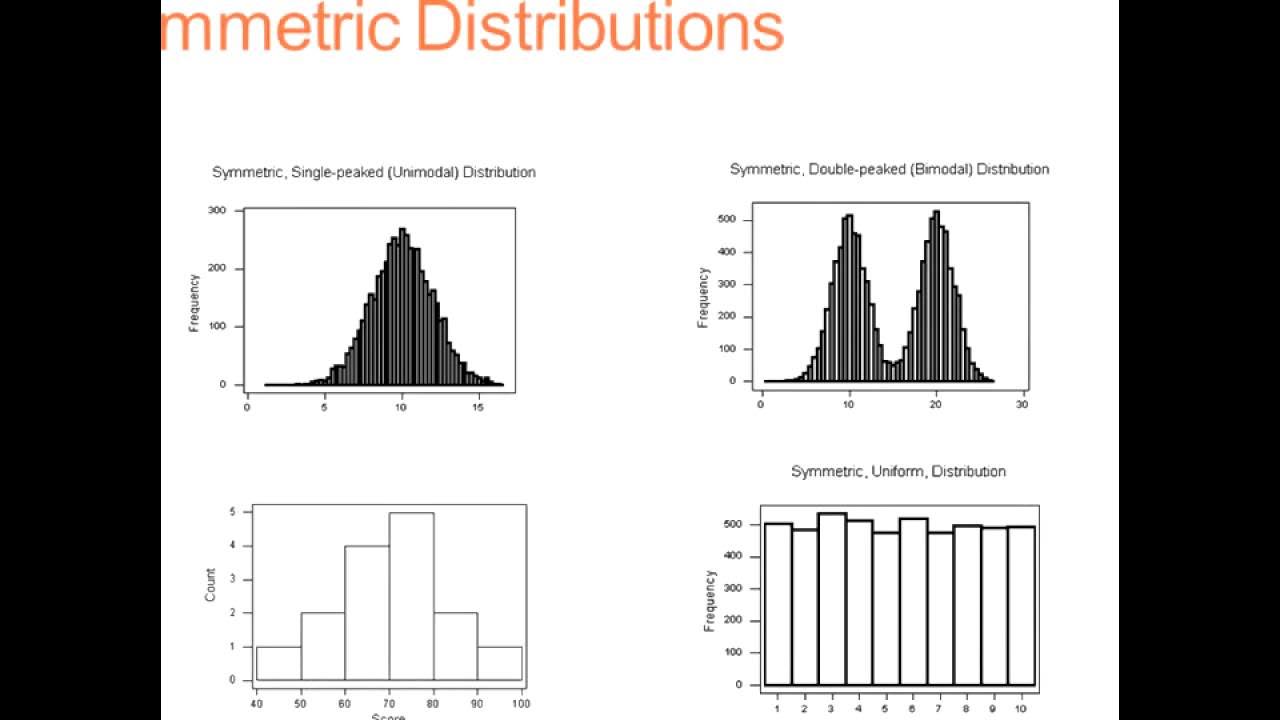
- 📈 The script provides examples of histograms to visually illustrate the concept of outliers and their numerical distance from the rest of the data set.
- 🌡️ An example of temperature data from Winnipeg is used to demonstrate how an outlier can skew the mean of a dataset, showing a mean of -28°C when it should be around 20-30°C.
- ❗ The presence of outliers can significantly alter the mean, making it less representative of the typical data values in a dataset.
- 🔄 The script compares calculations with and without outliers to show the difference in the mean, median, mode, range, and standard deviation.
- 🏔️ The median is less affected by outliers as it only considers the middle value of a dataset, remaining at 26°C even with the outlier present.
- 📊 The mode, which is the most frequently occurring value, remains unchanged at 31 in the dataset regardless of the presence of an outlier.
- 📉 The range, calculated as the difference between the maximum and minimum values, is greatly affected by outliers, jumping from 16 to 381 in the example provided.
- 📊 The standard deviation is also influenced by outliers since it is calculated based on the mean, which is affected by outliers.
- 📉 The script concludes that while the median and mode are resistant to outliers, the mean, range, and standard deviation are highly sensitive to their presence.
Q & A
What is an outlier in the context of a dataset?
-An outlier is a data point that is numerically distant from the rest of the dataset, either being the largest or smallest value, and falls outside the main pattern of data points.
How can outliers be identified in a histogram?
-Outliers in a histogram can be identified as points that are numerically distant from the majority of the data, often appearing as data points that are far away from the main cluster of data.
What is the impact of an outlier on the mean of a dataset?
-Outliers can significantly skew the mean of a dataset, leading to a result that does not accurately represent the typical values within the dataset.
How does the presence of an outlier affect the median of a dataset?
-The median is resistant to the presence of outliers because it is only affected by the middle value(s) of a dataset, regardless of how extreme the outliers are.
What is the mode in a dataset and how is it affected by outliers?
-The mode is the most frequently appearing data value in a dataset. It is resistant to the presence of outliers because it is determined by the frequency of data points, not their magnitude.
How is the range of a dataset influenced by outliers?
-The range, which is calculated as the difference between the maximum and minimum values, can be drastically affected by outliers, as they can be either the maximum or minimum value in the dataset.
Why is the standard deviation affected by outliers?
-The standard deviation is affected by outliers because it is calculated based on the mean, which is inherently affected by outliers, and it measures the amount of variation or dispersion in the dataset.
What is a practical example of an outlier mentioned in the script?
-A practical example of an outlier mentioned in the script is a temperature reading of negative 350 degrees Celsius for Winnipeg on July 1st, which is clearly atypical for summer temperatures.
How does excluding an outlier from calculations change the mean of the dataset?
-Excluding an outlier from calculations can result in a mean that is closer to the typical values of the dataset, as demonstrated by the script where the mean changed from negative 28 to 25.667 degrees Celsius.
What are some characteristics of outliers that make them atypical and surprising in a dataset?
-Outliers are atypical and surprising because they are numerically distant from the dataset, often being significantly larger or smaller than the majority of data points, and they deviate from the expected pattern.
How can the presence of an outlier affect the interpretation of statistical measures in a dataset?
-The presence of an outlier can lead to a misinterpretation of statistical measures such as the mean and standard deviation, as these measures can be significantly skewed by extreme values, while the median and mode are more resistant to such distortions.
Outlines

This section is available to paid users only. Please upgrade to access this part.
Upgrade NowMindmap

This section is available to paid users only. Please upgrade to access this part.
Upgrade NowKeywords

This section is available to paid users only. Please upgrade to access this part.
Upgrade NowHighlights

This section is available to paid users only. Please upgrade to access this part.
Upgrade NowTranscripts

This section is available to paid users only. Please upgrade to access this part.
Upgrade NowBrowse More Related Video
Measures of Spread & Variability: Range, Variance, SD, etc| Statistics Tutorial | MarinStatsLectures

Five-Number Summaries and Boxplots

Standard Deviation - Explained and Visualized
6050/6052 Unit 1 - Describing Distributions
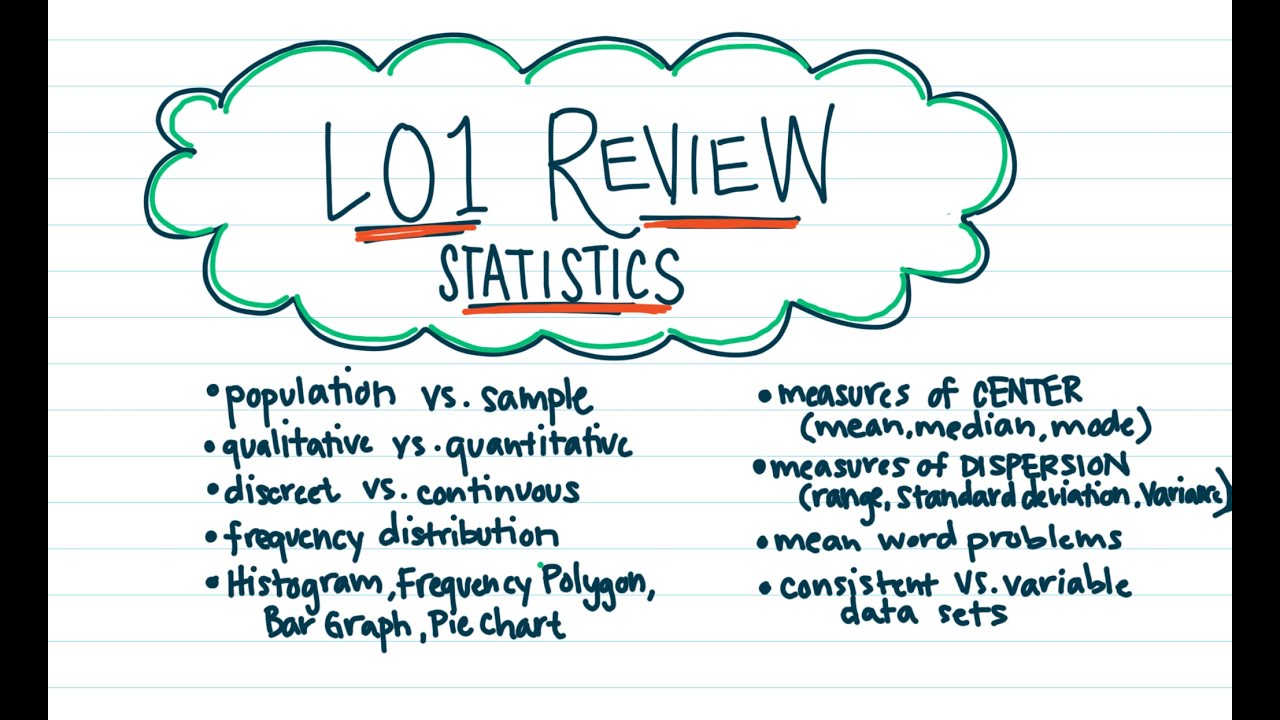
LO1 Review
Mean, Median and Mode in Statistics | Statistics Tutorial | MarinStatsLectures
5.0 / 5 (0 votes)