MACD Indicator Explained: 4 Advanced Strategies

Trade Prime
6 May 202327:04

Summary

TLDRThis video offers a comprehensive guide to the MACD indicator, ideal for both beginners and advanced traders. It explains the MACD's components (MACD line, signal line, and histogram) and demonstrates various uses such as histogram slopes, crossovers, zero-line pullbacks, and divergences. Additionally, it presents four advanced trading strategies combining MACD with other concepts like support and resistance, Bollinger Bands, EMA bands, and swap zones. The video aims to enhance trading skills by identifying trade opportunities and applying these techniques in different market conditions.

Takeaways

  • 📈 The MACD (Moving Average Convergence Divergence) indicator is used to identify trends and price momentum, consisting of three components: the MACD line, signal line, and histogram.
  • 🔍 The MACD line is calculated by subtracting a 26-period EMA from a 12-period EMA, indicating the relationship between short-term and long-term trends.
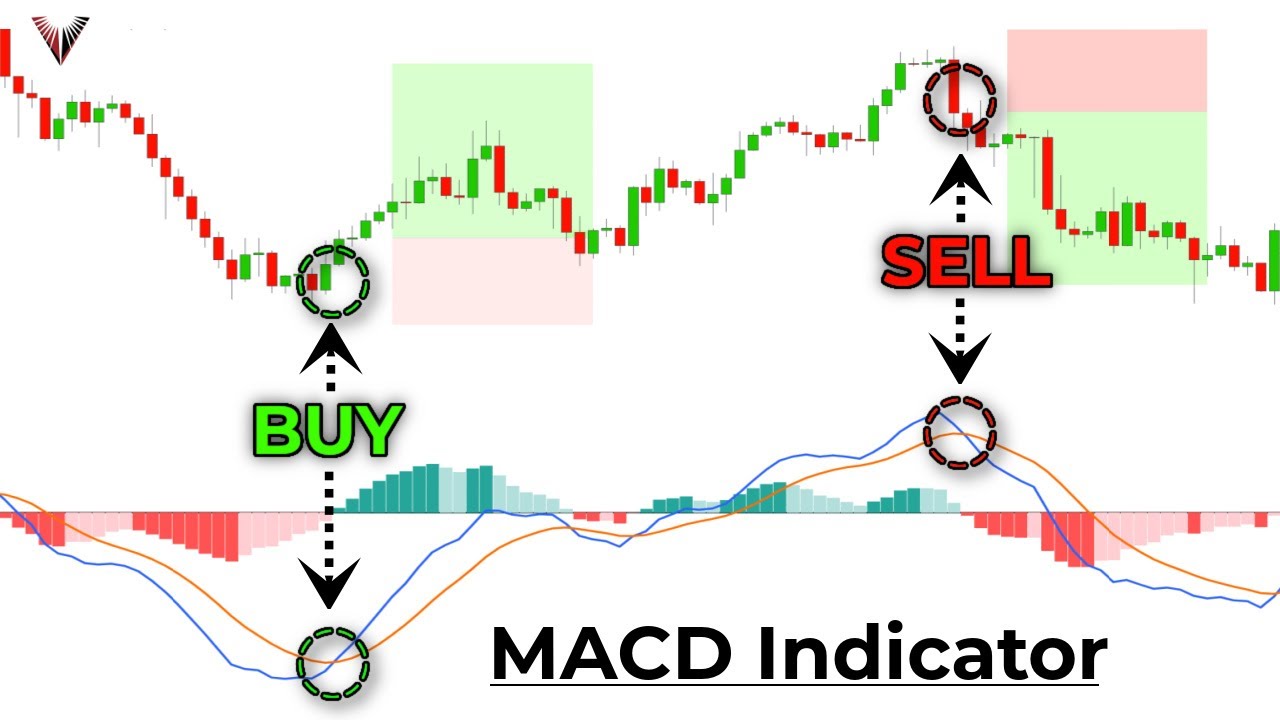
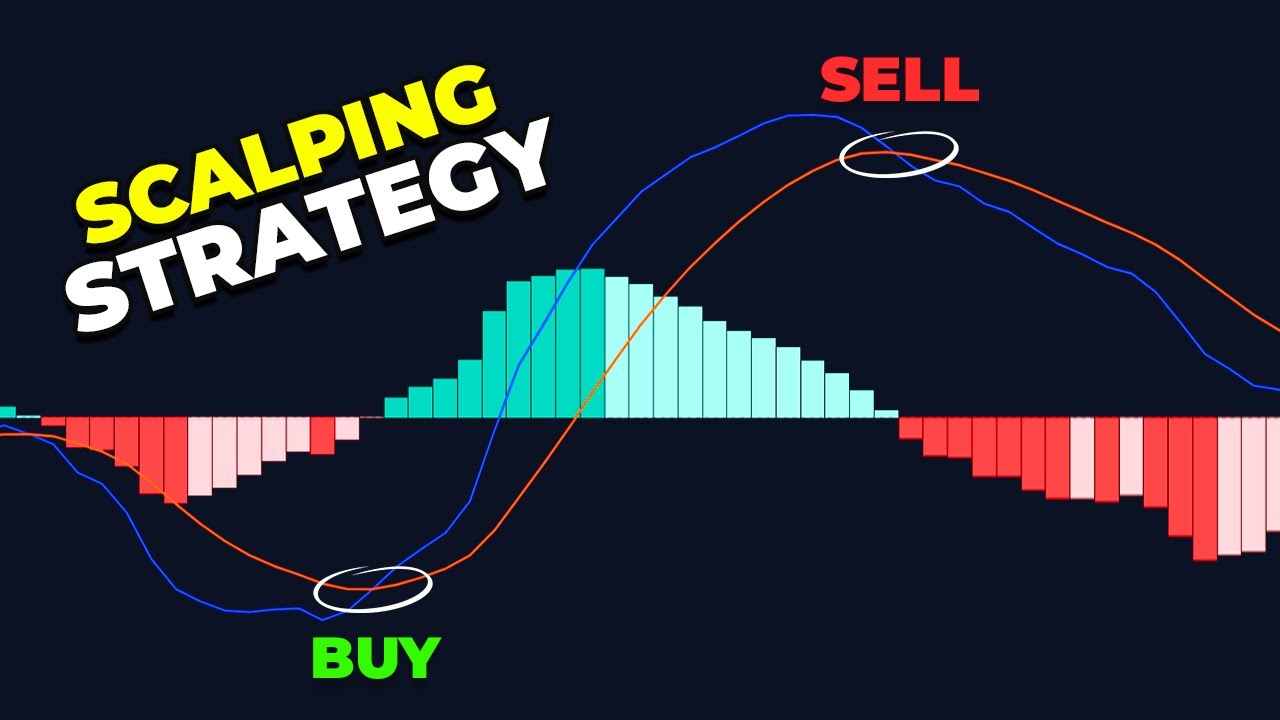
  • 📊 The signal line, a 9-period EMA of the MACD line, serves as a trigger for potential entry points through crossovers.
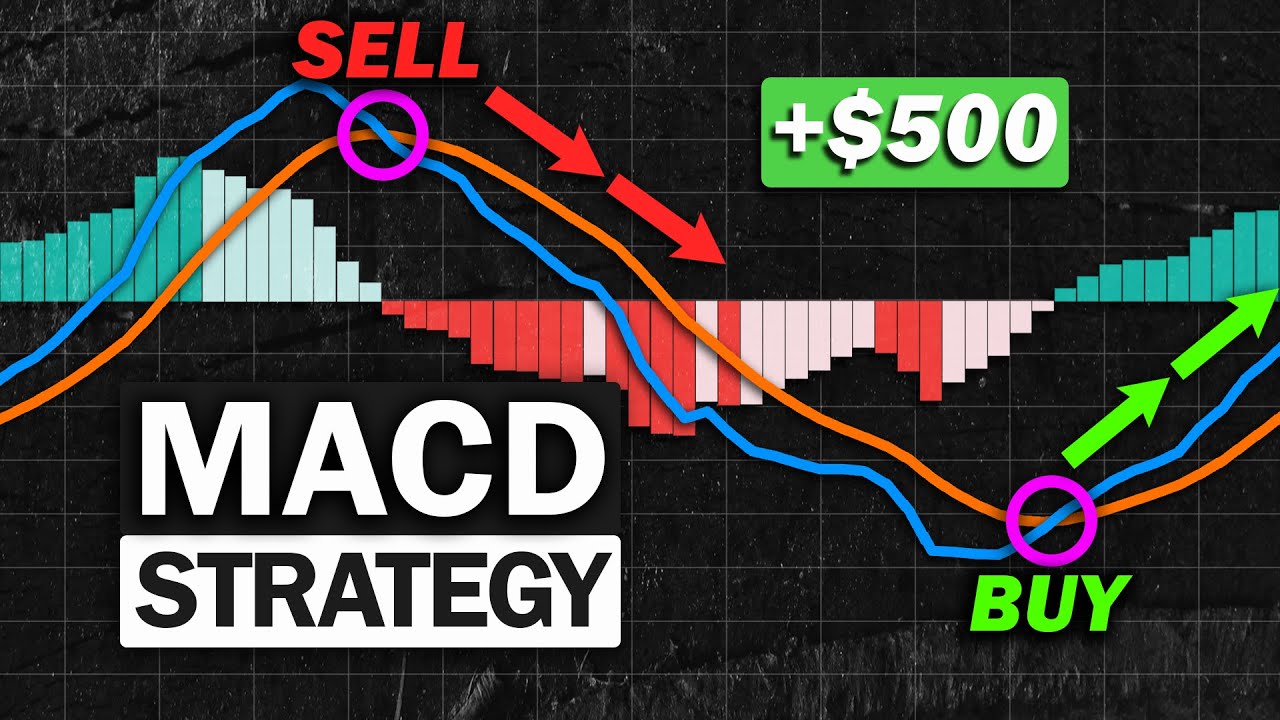
  • 📊 The histogram represents the difference between the MACD line and the signal line, providing insights into the strength and direction of the trend's momentum.
  • 📉 An expanding histogram indicates growing momentum in the direction of the trend, while a shrinking histogram suggests weakening momentum and potential trend reversal or sideways movement.
  • 🔄 MACD crossovers can provide early signs of trend reversals and better entry points compared to traditional moving average crossovers.
  • 🔢 Zero line crossovers by the MACD line indicate shifts in trend momentum and potential trend changes, offering fewer false signals than standard crossovers.
  • 🔄 Zero line pullbacks in strong trends can be used to identify high-probability trade entries when the MACD line interacts with the zero line.
  • 🔄 Divergence occurs when price action and the MACD histogram show conflicting signals, often signaling a potential trend reversal.
  • 📉 Bearish divergence indicates weakening buying pressure, while bullish divergence suggests fading selling pressure, both being potential reversal signals.
  • 📈 Advanced strategies combining MACD with other concepts like support/resistance, Bollinger Bands, EMA bands, and swap zones can enhance trading decisions in various market conditions.

Q & A

  • What is the purpose of the MACD indicator?

    -The MACD (Moving Average Convergence Divergence) indicator is used to identify trends and momentum of the price in the financial markets.

  • What are the three components of the MACD indicator?

    -The three components of the MACD indicator are the MACD line, the signal line, and the histogram.

  • How is the MACD line calculated?

    -The MACD line is calculated by subtracting the 26-period EMA (Exponential Moving Average) from the 12-period EMA.

  • What does the signal line represent in the MACD indicator?

    -The signal line is a nine-period EMA of the MACD line and is used to provide crossovers as an entry trigger for trades.

  • How does the histogram in the MACD indicator reflect the price's momentum?

    -The histogram calculates the distance between the MACD line and the signal line, reflecting the momentum of the price. Green bars above the zero line indicate an uptrend, while red bars below indicate a downtrend.

  • What does the slope of the histogram indicate about the trend strength?

    -An expanding histogram indicates a strong trend with growing momentum, while a shrinking histogram suggests that the trend is losing momentum and may reverse or move sideways.

  • How can the MACD crossover be used as an early sign of a reversal?

    -The MACD crossover can provide an early indication of a reversal by showing when the MACD line crosses the signal line, which can happen before the price moves significantly.

  • What is a zero line crossover in the context of the MACD indicator?

    -A zero line crossover occurs when the MACD line crosses above or below the zero line, indicating a potential shift in trend and momentum.

  • What is a Divergence in the context of the MACD indicator and why is it significant?

    -A Divergence occurs when the price and the MACD give different outputs, such as a lower low in price with a higher low in the MACD (bullish divergence) or a higher high in price with a lower high in the MACD (bearish divergence). It is significant as it can signal an impending trend reversal.

  • How can the MACD indicator be combined with other concepts to create advanced trading strategies?

    -The MACD indicator can be combined with concepts like support and resistance, Bollinger Bands, EMA bands, and swap zones to create advanced trading strategies that can be used in different market conditions.

  • What is a swap zone and how is it used in trading strategies with the MACD indicator?

    -A swap zone is a level that changes its role from resistance to support or vice versa after a breakout. It is used in trading strategies with the MACD indicator to identify potential reversal areas where the price may bounce back after a pullback to the swap zone.

  • Can you provide an example of a trading strategy using the MACD indicator with Bollinger Bands?

    -One strategy involves looking for a bearish or bullish Divergence on the MACD while the price is outside the Bollinger Bands. A sell trade entry might occur when the price closes back inside the bands after a bearish Divergence, and a buy trade entry might occur when the price closes above the lower band after a bullish Divergence.

  • How are EMA bands used in trend-following strategies with the MACD indicator?

    -EMA bands, calculated on the highs, closes, and lows of the candles, provide dynamic support and resistance levels. In an uptrend, a pullback to these bands followed by a MACD line crossing above the zero line can signal a buy entry. Conversely, in a downtrend, a pullback to the bands followed by a MACD line crossing below the zero line can signal a sell entry.

Outlines

00:00

📈 Introduction to MACD Indicator Guide

This paragraph introduces a comprehensive guide to the MACD (Moving Average Convergence Divergence) indicator, tailored for traders of all levels. It outlines the video's content, which includes the basics of the MACD, its components (MACD line, signal line, and histogram), and its application in identifying trade opportunities through techniques like histogram slope, crossovers, zero line pullbacks, and divergences. The guide also promises to combine MACD with other concepts to form advanced strategies for trading reversals and trends.

05:00

📊 Understanding MACD Components and Market Conditions

This section delves into the MACD indicator's components, explaining how the MACD line is derived from the difference between two exponential moving averages (EMAs), the signal line as a smoothed version of the MACD line, and the histogram as a visual representation of momentum. It discusses how to interpret the histogram's slope and color changes to gauge market trends and potential trade entries or exits. The paragraph also emphasizes the importance of not relying solely on the MACD for trade decisions, suggesting that it will be combined with other factors in advanced strategies.

10:03

🔄 MACD Crossover and Zero Line Applications

The paragraph explores the use of MACD crossovers as an early sign of potential trend reversals, offering better entry points and tighter stop losses compared to traditional moving average crossovers. It also explains the concept of zero line crossovers, which indicate shifts in trend and momentum, and the use of MACD pullbacks to the zero line in strong trending markets as potential entry points for trades. The importance of confirming these signals with additional factors is highlighted to avoid false signals.

15:05

🔄 Divergence as a Reversal Signal

This section introduces the concept of divergence as a powerful tool for spotting trend changes. Divergence occurs when there is a discrepancy between the price action and the MACD indicator, signaling potential exhaustion of momentum and a likely reversal. The paragraph differentiates between bullish and bearish divergences, providing examples of each and emphasizing the importance of identifying clear and obvious divergences for high-probability trades.

20:07

🚀 Advanced MACD Trading Strategies

The paragraph outlines four advanced trading strategies that incorporate the MACD indicator. The first two strategies focus on reversal setups, combining divergence with support and resistance levels or Bollinger Bands, to identify high-probability trade entries. The latter two strategies are trend-following, using EMA bands and swap zones in conjunction with the MACD to capitalize on pullbacks in strong trends. Each strategy is designed to address different market conditions, providing a versatile approach to trading with the MACD indicator.

25:08

📉 Final Thoughts on Trading with MACD

In the concluding paragraph, the video summarizes the uses of the MACD indicator and the four advanced trading strategies discussed. It invites viewers to share suggestions for future topics and to provide feedback on the video. The paragraph also encourages viewers to like, subscribe, and follow the channel on Instagram for more content, emphasizing the value provided and the desire for viewer engagement.

Mindmap

Keywords

💡MACD

MACD stands for Moving Average Convergence Divergence and is a technical indicator used by traders to identify trends and momentum in the price of a security. It consists of three components: the MACD line, the signal line, and the histogram. In the video, MACD is the central theme, with its explanation and application in trading strategies being the primary focus.

💡EMA

EMA, or Exponential Moving Average, is a type of moving average that places a greater weight and significance on the most recent data points. It is used in calculating the MACD line by subtracting the 26-period EMA from the 12-period EMA. The script mentions EMA in the context of forming the MACD line and as part of the strategy involving EMA bands.

💡Histogram

The histogram in the MACD indicator is a visual representation of the difference between the MACD line and the signal line. When the MACD line is above the signal line, the histogram shows green bars, indicating an uptrend. Conversely, red bars indicate a downtrend. The script explains how the histogram's slope and color can signal the strength or weakness of a trend.

💡Crossover

A crossover in the MACD occurs when the MACD line crosses the signal line. This can be an early sign of a trend reversal and is used as an entry trigger in trading. The video script discusses both MACD line crossovers and zero line crossovers as part of different trading strategies.

💡Divergence

Divergence occurs when the price action and the MACD indicator show conflicting signals. A bullish divergence happens when the price makes a lower low but the MACD makes a higher low, suggesting a potential upward price movement. The script uses divergence as a critical concept for spotting trend changes and as part of the trading strategies.

💡Support and Resistance

Support and resistance levels are price points on a chart where the price tends to stop and reverse. Support is where buyers are expected to enter, and resistance is where sellers are expected to take over. The script discusses using these levels in conjunction with MACD divergences for trading setups.

💡Bollinger Bands

Bollinger Bands are a volatility indicator that consists of a middle band being a simple moving average, and an upper and lower band that are two standard deviations away from the middle band. The script mentions using Bollinger Bands in combination with MACD divergences to trade reversals.

💡Zero Line

The zero line in the MACD indicator represents the midpoint and is used to determine the overall trend direction. When the MACD line crosses above the zero line, it suggests an uptrend, and when it crosses below, it suggests a downtrend. The video script refers to zero line crossovers and pullbacks as part of the trading strategies.

💡EMA Bands

EMA Bands, as discussed in the script, are a set of three exponential moving averages calculated using different sources (highs, closes, lows) of candlestick data. They are used to identify support and resistance levels in trending markets. The script explains using EMA bands in conjunction with the MACD for trend-following trades.

💡Swap Zones

Swap Zones refer to the concept where a resistance level becomes a support level after a breakout and vice versa. The script uses this concept in a trading strategy where the MACD and swap zones are combined to trade pullbacks in the market.

Highlights

The MACD indicator is used to identify trends and momentum of the price.

MACD stands for Moving Average Convergence Divergence.

The MACD indicator consists of three components: the MACD line, the signal line, and the histogram.

The MACD line is calculated by subtracting the 26 period EMA from the 12 period EMA.

The signal line is a nine period EMA of the MACD line, providing entry triggers through crossovers.

The histogram reflects the distance between the MACD line and the signal line, indicating momentum.

Histogram slope and expansion can signal growing or weakening momentum and potential trend direction.

MACD crossovers can provide early signs of reversal and better entry points than traditional moving averages.

Zero line crossovers by the MACD line indicate shifts in trend and momentum.

Divergence occurs when price and MACD give different outputs, signaling potential trend changes.

Bullish divergence suggests weakening sellers' momentum, while bearish divergence indicates weakening buyers' momentum.

Combining MACD with support and resistance levels can create high-probability reversal setups.

Bollinger Bands combined with MACD Divergence can indicate reversals when price moves outside the bands.

EMA bands created from highs, closes, and lows can provide support and resistance in trending markets.

Swap zones, where support and resistance levels swap roles, can be used with MACD for pullback trades.

Four advanced MACD strategies are discussed for trading reversals and trends in different market conditions.

Divergence should be clear and obvious to the naked eye for reliable trading signals.

Transcripts

play00:00

in this video we have collected

play00:02

information from various sources to

play00:05

provide a complete guide to the macd

play00:07

indicator

play00:08

we created this video course for the

play00:10

Trader at entry level so if you are a

play00:13

beginner or an advanced Trader watch the

play00:15

full video to grasp every Concept in

play00:18

detail

play00:20

here are the topics covered in this

play00:22

course

play00:24

we will cover the basics of the macd

play00:26

indicator including what it is and how

play00:28

it works

play00:30

we will accomplish this by understanding

play00:32

the components of the macd such as the

play00:35

macd line signal line and histogram

play00:39

next we will dive deep into the uses of

play00:42

the macd indicator including the

play00:44

histogram slope crossovers zero line

play00:47

crossovers zero line pullbacks and

play00:50

divergences

play00:51

you will learn how to use these

play00:53

techniques to identify trade

play00:55

opportunities

play00:56

finally we will combine the uses of macd

play00:59

with other Concepts to create four

play01:01

Advanced strategies you can use to trade

play01:04

different market conditions

play01:06

you will learn how to use the macd to

play01:09

trade reversals and trends

play01:11

so without any further Ado let's get

play01:14

started

play01:17

what is the macd indicator

play01:21

macd stands for moving average

play01:23

convergence Divergence it is used to

play01:27

identify Trends and momentum of the

play01:29

price

play01:30

the macd indicator consists of three

play01:32

components the macd line the signal line

play01:36

and the histogram

play01:39

let's understand each of these

play01:40

components in detail

play01:42

first let's start with the macd line

play01:47

the macd line is calculated by

play01:49

subtracting the 26 period EMA from the

play01:53

12 period EMA

play01:56

this means that whenever the 12 EMA is

play01:59

above the 26 EMA the macd line will be

play02:02

above zero

play02:05

when the 12 EMA moves below the 26 EMA

play02:09

the macd line goes below zero

play02:13

next we have the signal line

play02:16

the signal line is a nine period

play02:19

exponential moving average of the macd

play02:21

line

play02:23

the signal line aims to provide

play02:25

crossovers as an entry trigger

play02:28

lastly we have the histogram

play02:31

the histogram calculates the distance

play02:33

between the macd line and the signal

play02:36

line

play02:37

by doing so it gives us a better

play02:39

understanding of the momentum

play02:42

when the macd line is above the signal

play02:44

line the histogram will show Green bars

play02:47

above the zero line

play02:49

this shows us that the price is in an

play02:52

uptrend

play02:52

[Music]

play02:54

on the other hand when the macd line is

play02:56

below the signal line the histogram will

play02:59

show red bars below the zero line

play03:03

so these are the three components of the

play03:05

macd

play03:06

we have the macd line the signal line

play03:09

and the histogram

play03:13

now let's understand how to use these

play03:16

components in different market

play03:17

conditions

play03:20

use one histogram slope

play03:24

the slope or shape of the histogram

play03:26

gives us a deeper understanding of the

play03:29

trend

play03:30

when the price is in a strong Trend the

play03:33

distance between the macd line and the

play03:35

signal line increases as a result the

play03:38

histogram expands

play03:40

an expanding histogram is a sign of

play03:43

growing momentum

play03:45

therefore if the histogram is expanding

play03:48

we should look for entries in the

play03:50

direction of the trend

play03:52

as the trend gets weak the histogram

play03:54

starts to shrink

play03:56

this is a sign that the momentum of the

play03:59

move is lost and the price might reverse

play04:01

or stay sideways

play04:04

during such times it is better to exit

play04:06

our trades and wait for the price to

play04:08

generate momentum again

play04:10

for a better visual presentation the

play04:13

macd histogram on trading view has light

play04:16

and dark colors

play04:18

we see dark colors when the histogram is

play04:21

expanding and light colors when the

play04:23

histogram is shrinking

play04:25

at the beginning of an up move when you

play04:28

see two or more dark green bars with an

play04:30

expanding histogram it is a sign that

play04:33

the upwards momentum is solid and

play04:35

growing

play04:36

therefore it is an excellent opportunity

play04:38

to look for buying entries

play04:41

then when the histogram starts to fall

play04:43

or decrease in size it is time to get

play04:46

out of the trade

play04:48

this indicates that the momentum has

play04:50

decreased and a reversal or a sideways

play04:53

Trend May establish itself

play04:55

as you can see the shrinking of the

play04:58

histogram coincides with this sideways

play05:00

range

play05:01

then we have this down move

play05:03

at the beginning of the down move we see

play05:06

these dark red bars with an expanding

play05:08

histogram

play05:10

if you haven't already this is your last

play05:12

chance to exit your previous buy

play05:14

positions

play05:16

these dark red bars sign that new

play05:18

sellers have entered the markets and

play05:21

they are moving the markets with heavy

play05:22

momentum

play05:24

it's time to enter new cell trades

play05:27

then once the price moves a certain

play05:29

distance the histogram starts to shrink

play05:32

as we see these light red bars

play05:35

it is an early indication that the down

play05:37

move is losing momentum and a reversal

play05:40

or sideways range May establish itself

play05:44

and as you can see the price stayed

play05:47

sideways as the histogram shrank itself

play05:50

again a point to remember here is that

play05:53

this is just one use of the macd you

play05:56

cannot make trade decisions based on

play05:58

this one factor alone

play06:00

we will show you how to combine it with

play06:02

other factors in the advanced strategies

play06:05

if you are enjoying this video so far

play06:07

then be sure to hit the like button and

play06:09

subscribe to our channel to never miss

play06:11

any of our videos

play06:13

you can also follow us on Instagram by

play06:15

clicking the link in the description

play06:16

below

play06:18

now moving on to the second use

play06:21

two crossovers

play06:24

a lot of Traders like to use the moving

play06:27

average crossover system for their

play06:28

trading but crossovers happen only after

play06:31

a good move in price

play06:33

as a result our entries are late and the

play06:36

price has already moved a lot to address

play06:39

this problem we could use the macd

play06:42

crossover

play06:44

the macd crossover can give you an early

play06:46

sign of a reversal it can also provide

play06:49

you with better entries and smaller stop

play06:52

losses

play06:53

to prove this I have plotted the 12 and

play06:56

26 EMAs on the chart along with the macd

play07:00

as you already know the macd is

play07:02

calculated on the 12 and 26 EMA so this

play07:06

should be a fair comparison

play07:09

here is the reversal point

play07:11

from this point the price reversed from

play07:14

an uptrend to a downtrend

play07:16

the crossover for the moving averages

play07:19

occurred here

play07:20

so your entry would be on this candle

play07:23

as you can see the price had already

play07:26

moved quite some distance before giving

play07:28

the crossover signal

play07:30

so ideally your stop loss would be above

play07:33

this High which is quite a wide stop

play07:35

loss

play07:36

but if you look at the macd your entry

play07:40

signal would be on this candle as the

play07:42

macd line crossed below the signal line

play07:45

it gives you a far superior entry price

play07:48

with a tight stop loss as a result you

play07:51

capture a bigger portion of the price

play07:53

move

play07:54

here is another example we can see that

play07:58

the 12 EMA crossed above the 26 EMA on

play08:02

this candle it is a bullish crossover so

play08:05

a buy entry occurs here

play08:07

but the crossover happens only after the

play08:10

price has moved a certain distance on

play08:13

the other hand the macd crossover

play08:15

occurred here giving us a far better

play08:18

entry price

play08:19

as a result we captured a good portion

play08:22

of this move with a tighter stop loss

play08:25

macd crossovers can be an early sign of

play08:28

reversal but they generate far more

play08:30

false signals so we can't use these

play08:33

crossovers in isolation a more confirmed

play08:36

signal is the zero line crossover

play08:39

foreign

play08:40

use three zero line crossover

play08:44

the macd consists of a zero line which

play08:47

is known as the midpoint of the

play08:49

indicator when the 12 EMA crosses below

play08:52

the 26 EMA the macd line moves below the

play08:56

zero line

play08:57

this shows that the trend and momentum

play08:59

have shifted downwards and a downtrend

play09:01

may start

play09:03

similarly when the 12 EMA crosses above

play09:06

the 26 EMA the macd line moves above the

play09:10

zero line

play09:11

this shows that the trend and momentum

play09:13

have shifted upwards and the price may

play09:16

start an uptrend now

play09:18

the zero line crossovers give fewer

play09:20

false signals but again we need to add

play09:23

more confirmations for them to be high

play09:25

probability trades

play09:29

use 4 zero line pullbacks

play09:33

in strong trending markets the macd line

play09:36

will often pull back to the zero line

play09:38

and the price will bounce back

play09:41

so in an uptrend if the macd line pulls

play09:44

back to the zero line it is a good place

play09:46

to make buy trades but again we cannot

play09:49

randomly buy whenever the macd line

play09:52

reaches zero

play09:53

we must wait for the macd line to cross

play09:56

above the signal line to make a Buy

play09:58

trade

play09:59

similarly in a downtrend if the macd

play10:02

line pulls back to the zero line it is a

play10:05

good place to make cell entries

play10:08

we wait for the macd line to cross below

play10:10

the signal line we enter on the

play10:13

crossover

play10:14

now moving on to the last use

play10:18

5 Divergence

play10:22

Divergence is a sign of reversal and it

play10:24

can be very helpful in spotting Trend

play10:26

changes

play10:28

a Divergence occurs when the price and

play10:30

the macd give different outputs

play10:33

we will use the histogram to spot these

play10:36

divergences

play10:37

divergences are of two types A bullish

play10:40

Divergence and a bearish Divergence

play10:45

a bullish Divergence occurs when the

play10:48

price makes a lower low but the macd

play10:50

makes a higher low

play10:52

this shows that the momentum on the last

play10:55

down move was lesser than the prior down

play10:57

move

play10:58

it is a sign that the sellers are tired

play11:01

and the price will likely stall or

play11:03

reverse

play11:04

here is an example

play11:06

here the price was in a downtrend the

play11:09

price created these three lower lows

play11:12

each low being lower than the previous

play11:14

one

play11:15

however the macd makes higher lows this

play11:19

is a clear Divergence it shows that the

play11:22

sellers are losing their strength and a

play11:24

reversal may occur so this becomes a

play11:27

good Buy Signal

play11:29

[Music]

play11:31

now let's understand the bearish

play11:33

Divergence

play11:35

a bearish Divergence occurs when the

play11:37

price makes a higher high but the macd

play11:40

makes a lower high

play11:43

this shows that the momentum on the last

play11:45

up move was lesser than the prior up

play11:48

move

play11:49

it is a sign that the buyers are tired

play11:51

and the price will likely stall or

play11:53

reverse

play11:54

here's an example

play11:56

here the price was initially in an

play11:58

uptrend

play11:59

the price makes a higher high but on the

play12:02

macd we see lower highs this is a clear

play12:05

bearish Divergence it is a sign that the

play12:08

buyers are losing momentum and strength

play12:11

as a consequence the sellers might jump

play12:14

in and take these prices downwards

play12:17

a lot of Traders find it difficult to

play12:19

find entries on divergences but don't

play12:21

worry we will show you our special

play12:23

technique in the strategies section

play12:26

a quick note about Divergence only look

play12:29

at divergences if they are clear and

play12:31

obvious it should be apparent to the

play12:33

naked eye

play12:34

here is an example

play12:37

here the price made this higher high but

play12:40

on the macd we have a lower Highs but

play12:43

the Divergence is not very clear on the

play12:45

macd

play12:46

these two tops seem equal to the naked

play12:49

eye

play12:50

we need a close examination to see if

play12:52

the second top is lower than the first

play12:54

so the best thing to do here is to avoid

play12:57

such divergences

play12:59

on the other hand this was a clear

play13:02

Divergence

play13:03

the price makes higher Highs but the

play13:05

macd makes lower highs we should look

play13:08

for these types of divergences

play13:11

divergences that are obvious to the eye

play13:13

can be very powerful so these were the

play13:16

five uses of the macd indicator

play13:19

now let's discuss the strategies that

play13:21

can be created around the macd indicator

play13:25

the first two strategies are reversal

play13:28

setups

play13:29

while the last two are Trend following

play13:32

setups

play13:33

these four strategies will enable you to

play13:36

trade the markets in any condition

play13:38

you can use these reversal setups when

play13:41

the price is in a range-bound market

play13:43

and during strong Trends the trend

play13:46

following strategies will help you catch

play13:48

pullbacks

play13:51

strategy one

play13:52

Divergence plus support and resistance

play13:56

as we already discussed Divergence is a

play13:59

strong sign of reversal but we cannot

play14:01

trade every Divergence

play14:04

we need to identify potential reversal

play14:06

areas and wait for the macd to create

play14:09

Divergence around those areas

play14:12

for this we will use the concepts of

play14:14

support and resistance

play14:16

we will first identify the support and

play14:19

resistance levels on a higher time frame

play14:22

then wait for Divergence on a lower time

play14:25

frame

play14:25

here is an example

play14:27

we have the GBP USD pair on the four

play14:31

hour chart

play14:33

the price made an up move and then

play14:35

reversed so we plot a level of

play14:38

resistance here

play14:39

when the price arrives near the

play14:41

resistance for the second time we expect

play14:44

the price to reverse downwards again

play14:47

so we switch to a one hour chart to look

play14:50

for Divergence

play14:52

here is the same price action on a one

play14:54

hour chart

play14:56

we see that the price made a higher high

play14:58

coming into the resistance level

play15:01

but on the macd we see lower highs

play15:05

this is a clear and obvious bearish

play15:07

Divergence

play15:09

it tells us that the buyers have lost

play15:11

momentum coming into the resistance

play15:14

we have a Confluence of a resistance

play15:17

level with Divergence

play15:18

this is a high probability trade

play15:21

therefore we should look out for a sell

play15:24

trade

play15:26

for our entry we need to identify the

play15:28

lowest point between the tops on the

play15:30

macd

play15:33

these are the two tops

play15:35

here is the lowest point between them we

play15:38

draw a line at that bar

play15:41

then we wait for the histogram to break

play15:43

below that line

play15:45

on this bar the histogram breaks below

play15:48

the line

play15:49

so we enter a sell trade on the

play15:51

corresponding candle

play15:53

as you can see we saw a steep down move

play15:57

after our entry

play15:59

here is an example of a buy setup

play16:02

we have the USD JPY on a four hour chart

play16:07

this upside reversal helped us identify

play16:10

this support level

play16:12

when the price returns to this level we

play16:15

expect the price to find support and

play16:17

move upwards

play16:18

so we switch to a one hour time frame

play16:21

and look for a bullish Divergence

play16:24

the price makes a lower low coming into

play16:26

the support Zone

play16:28

but on the macd we see a higher low

play16:32

this is a clear and obvious Divergence

play16:35

it shows us that the sellers have lost

play16:38

their strength and momentum in this down

play16:40

move so we identify this as a high

play16:43

probability trade setup

play16:46

now we Mark the highest point between

play16:48

the bottoms on the macd and draw a line

play16:52

on this bar the histogram breaks above

play16:55

the line and it is a Buy Signal so we

play16:58

buy here

play17:00

as you can see the price made an up move

play17:02

and touched the most recent highs

play17:05

so this is how to use the Divergence

play17:08

with concepts of support and resistance

play17:11

now let's look at the second strategy

play17:15

strategy two Divergence plus Bollinger

play17:18

Bands

play17:20

Bollinger Bands are a very popular

play17:22

indicator that Traders use to trade

play17:24

reversals

play17:26

the theory is this

play17:28

ninety percent of the time the price is

play17:31

expected to stay Within These bands

play17:34

so whenever the price moves outside the

play17:37

bands we can expect the price to reverse

play17:40

and return inside

play17:42

if the price moves above the upper band

play17:44

we expect it to reverse downwards

play17:47

similarly if the price moves below the

play17:50

lower band we expect the price to

play17:53

reverse upwards

play17:55

we will combine this analogy with the

play17:57

macd Divergence

play17:59

but first we will go over the Bollinger

play18:02

band settings and change the length to

play18:04

200. we will keep the standard deviation

play18:07

to two

play18:08

this gives Bollinger Bands on the 200

play18:11

moving average

play18:13

here is a cell setup using this strategy

play18:17

here we see that the price was in an

play18:19

uptrend

play18:20

the trend was so strong that the price

play18:23

stayed above the upper Bollinger band

play18:25

for an extended period

play18:27

now we expect the price to move lower

play18:31

so we look for a bearish Divergence

play18:34

here the price made a higher high but

play18:37

the macd histogram made a lower high

play18:40

in fact on the second top we don't even

play18:43

see a green bar

play18:45

this is a great sign that the sellers

play18:48

have grabbed hold of the markets and the

play18:50

price will follow soon so a selling

play18:53

opportunity presents itself

play18:55

for this strategy our entry occurs on

play18:58

the first candle that closes back inside

play19:00

the Bands

play19:02

so this will be our entry candle

play19:05

and as you can see the price made a

play19:08

solid down move after our entry

play19:13

moving on to buy trade

play19:16

initially we saw a massive down move

play19:18

that stayed below the lower band

play19:21

the price spends a lot of time below the

play19:24

band we know that the price cannot spend

play19:27

so much time outside the bands so we are

play19:30

already expecting a reversal to the

play19:32

upside

play19:33

towards the end of the move we see the

play19:36

price was constantly making lower lows

play19:38

but the macd histogram was plotting

play19:41

higher lows this was a clear and obvious

play19:44

Divergence we have a combination of the

play19:47

Bollinger Bands and the macd Divergence

play19:50

it indicates that the sellers have lost

play19:52

all momentum coming into the down move

play19:55

the buyers are pushing hard and an

play19:58

upwards reversal may occur soon

play20:01

so we should look for a Buy trade

play20:04

our buy entry occurs as the price closes

play20:07

above the lower band on this candle

play20:10

as you can see the price shot up after

play20:13

our entry

play20:14

so this was a unique way of trading macd

play20:17

Divergence with Bollinger Bands

play20:21

now moving on to the trend trading

play20:23

strategies

play20:25

strategy 3 EMA bands plus zero line

play20:29

pullbacks

play20:31

for this strategy we will need four

play20:33

indicators we need the macd and the

play20:36

three exponential moving averages

play20:39

all three of them are 200 EMAs but with

play20:43

different sources

play20:44

the upper EMA is calculated on the highs

play20:47

of the candles

play20:49

the middle EMA is calculated on the

play20:51

close and the lower EMA is calculated on

play20:55

the lows

play20:57

for trading view users you can use the

play20:59

moving average ribbon indicator

play21:03

just go to the indicators section and

play21:05

search moving average ribbon select this

play21:08

indicator

play21:10

and change the settings to the following

play21:14

once done your chart should look

play21:16

something like this

play21:18

now we have these moving average bands

play21:21

that will help us identify trade

play21:23

opportunities when the price is trending

play21:25

these bands will provide support and

play21:28

resistance to the price

play21:32

in an uptrend we often see that the

play21:35

price pulls back to these moving

play21:36

averages and finds support

play21:40

similarly in a downtrend the price pulls

play21:43

back to these moving averages and finds

play21:45

resistance

play21:49

a point worth remembering here is that

play21:52

price will not always bounce exactly

play21:54

from the Bands sometimes the price goes

play21:57

deeper before reversing

play21:59

now let's combine this with the macd and

play22:02

create a strategy here is a buy setup

play22:06

the price made a strong up move here

play22:09

the price stayed above the bands and the

play22:12

bands were sloped upwards

play22:14

this is a sign that the price is in an

play22:16

uptrend

play22:18

then the price pulls back to the EMA

play22:21

bans

play22:23

now we expect the price to find support

play22:25

here and move upwards

play22:29

we also see that the macd line has

play22:32

crossed below the zero line

play22:35

in an uptrend we expect the price to

play22:37

bounce after the macd touches the zero

play22:40

line

play22:41

this is also a sign that the pullback

play22:43

might be over and that the price May

play22:46

resume the uptrend again

play22:48

so now we have a confirmation of the

play22:51

macd and the EMA bands

play22:54

for our entry we will not use the macd

play22:57

line crossover macd crossovers are good

play23:01

for reversals but they are not so good

play23:03

for pullbacks

play23:05

most of the time they will provide a

play23:08

late entry in pullbacks

play23:10

for a better entry we will create a

play23:13

short-term trend line on the pullback

play23:15

and enter on its Breakout

play23:17

as you can see the price made a strong

play23:20

up move after our entry

play23:24

here is a sell trade

play23:27

we see that the price was consistently

play23:29

trading below the EMA bans and the bans

play23:32

were sloped downwards

play23:34

this is a sign that the price was in a

play23:37

strong downtrend

play23:40

price pulls back to the Bands

play23:43

we expect the price to find resistance

play23:45

at these bands and move lower

play23:47

we also see that the macd has crossed

play23:50

above its zero line

play23:53

this also indicates that the price may

play23:55

start a down move again

play23:58

therefore we have a Confluence of the

play24:00

macd and the EMA bands

play24:03

now we create a short-term trend line

play24:06

and wait for the price to break it

play24:09

on this candle the price broke below the

play24:12

trend line

play24:13

we enter a sell trade

play24:16

as you can see the price moved downwards

play24:19

after our entry

play24:21

foreign

play24:22

strategy

play24:26

strategy 4. swap zones plus zero line

play24:30

pullbacks

play24:31

if you trade support and resistance you

play24:34

might know that the support and

play24:36

resistance have dual properties

play24:38

this means a resistance level can become

play24:41

a support level after a Breakout

play24:45

similarly a support level can act as

play24:48

resistance after its breakdown

play24:51

this is why we call them swap zones they

play24:55

swap roles with each other

play24:57

we will use this concept with the macd

play24:59

to trade this strategy here we see that

play25:03

the price was in a steady uptrend

play25:05

we spot this reversal here and plot a

play25:08

resistance level

play25:09

then the price broke above the

play25:12

resistance level

play25:13

therefore the resistance level has now

play25:15

turned into a support level

play25:18

when the price pulls back to the support

play25:20

level we expect the price to bounce and

play25:23

move upwards

play25:25

we also see that the macd line is below

play25:28

zero showing signs of support

play25:31

we spot this doji right at the support

play25:33

level and enter a Buy trade

play25:35

and as you can see the price shoots up

play25:38

and trades higher

play25:40

here is a sell trade

play25:42

here the price was in a downtrend as it

play25:45

moved lower

play25:47

this reversal Point helped us identify a

play25:50

support level

play25:51

then the price broke below it turning

play25:54

the support into a resistance level

play25:57

when the price pulls back to the

play25:59

resistance level we expect the price to

play26:01

bounce

play26:03

we also see that the macd has moved

play26:05

above the zero line

play26:07

so we enter a sell trade when we see

play26:10

this evening star Candlestick pattern

play26:13

and as you can see the price moved lower

play26:16

so this is how you trade using the macd

play26:21

in this video we first understood the

play26:23

uses of the macd indicator

play26:26

then we discussed four Advanced trading

play26:28

strategies using it

play26:30

if you want us to cover some specific

play26:32

topics be sure to comment below as we

play26:35

appreciate your suggestions also let us

play26:38

know what you think about this video

play26:40

if you found value in this video then be

play26:43

sure to hit the like button and

play26:44

subscribe to our channel so you don't

play26:46

miss any of our new videos you can also

play26:49

follow us on Instagram by clicking the

play26:51

link in the description below see you

play26:53

soon

play26:57

foreign

play26:58

[Music]

Rate This

5.0 / 5 (0 votes)

Related Tags
MACD GuideTrading BasicsAdvanced StrategiesTrader TipsInvestmentTechnical AnalysisEMADivergencesTrend ReversalsStock Market