The MACD Indicator For Beginners [Become An Expert Immediately]
Summary
TLDRThis comprehensive guide explores the MACD indicator, a popular tool in trading for identifying trends and generating buy/sell signals. The speaker clarifies that while the MACD is not a guaranteed path to profits, when correctly integrated with other analysis techniques, it can significantly enhance trading strategies. The video offers practical examples of how to use the MACD for trend identification, signal recognition, and spotting potential market reversals through divergence. It concludes with detailed profitable trading strategies utilizing the MACD, emphasizing the importance of combining it with sound risk management and trading psychology for long-term success.
Takeaways
- 📈 The MACD (Moving Average Convergence Divergence) indicator is a popular tool for identifying trends and generating buy/sell signals in trading.
- 🔍 MACD is not a 'holy grail' and can produce false signals if used improperly, but when used correctly, it can lead to profitable trading strategies.
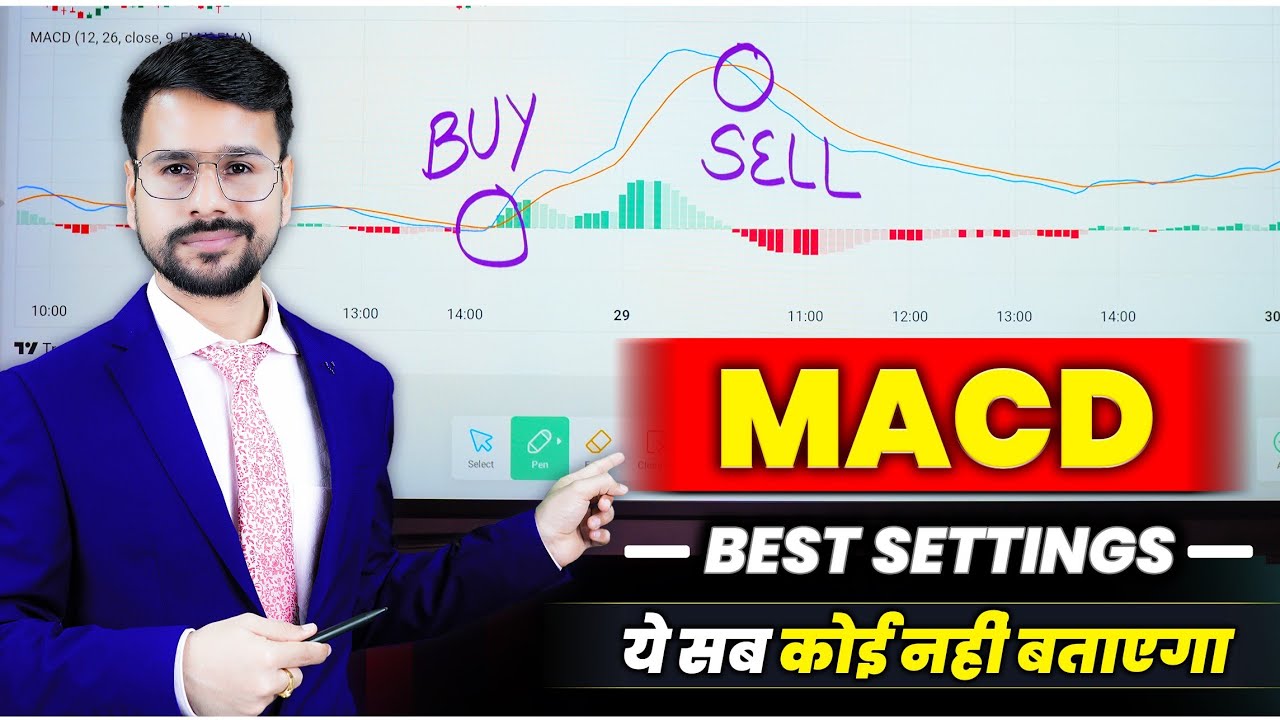
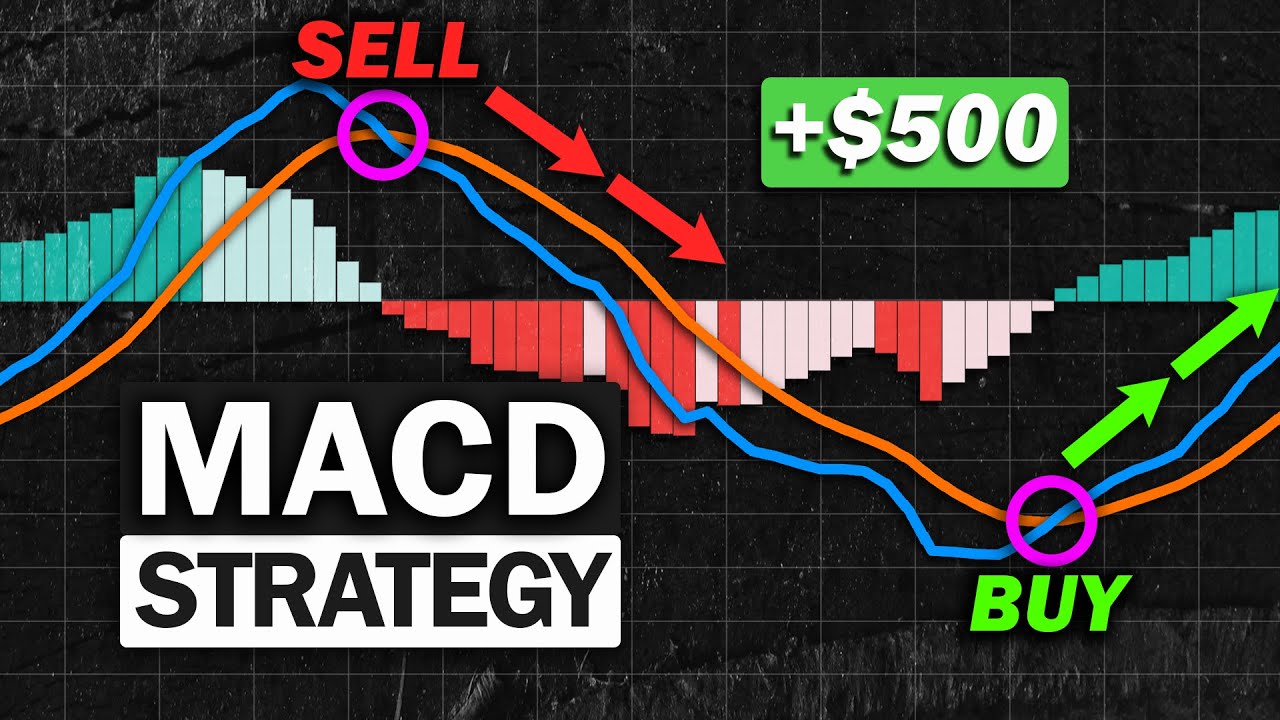
- 📊 The MACD consists of two lines (MACD line and Signal line) and a histogram, which shows the distance between the two lines and helps in visually identifying crossovers.
- 🔢 The MACD line is calculated as the difference between a 12-period EMA (Exponential Moving Average) and a 26-period EMA.
- 🛠 The Signal line is a 9-period EMA of the MACD line, smoothing it out to make it easier to interpret.
- 📉 MACD can be used to identify the trend of an asset, with the zero line and the positions of the MACD and Signal lines relative to it indicating uptrends or downtrends.
- 🤝 MACD signals should be used in conjunction with other technical analysis tools and indicators for increased accuracy and confirmation.
- 🔄 Divergence occurs when price action and the MACD indicator move in opposite directions, which can signal potential trend reversals.
- ✅ The video provides examples of high-probability trading opportunities by combining MACD with price action, support/resistance levels, and candlestick patterns.
- 📝 The presenter shares a rules-based trading strategy using MACD for trend continuation, which requires price to be above the 200-period EMA and specific MACD line crossovers.
- 💡 Successful trading relies on a combination of a profitable strategy, proper risk management, and sound trading psychology, not just on technical indicators like MACD.
Please replace the link and try again.
Outlines

This section is available to paid users only. Please upgrade to access this part.
Upgrade NowMindmap

This section is available to paid users only. Please upgrade to access this part.
Upgrade NowKeywords

This section is available to paid users only. Please upgrade to access this part.
Upgrade NowHighlights

This section is available to paid users only. Please upgrade to access this part.
Upgrade NowTranscripts

This section is available to paid users only. Please upgrade to access this part.
Upgrade NowBrowse More Related Video
NEVER Miss a TREND! MACD Indicator Trading Strategy | MACD Divergence

Top 3 FREE TradingView BuySell Indicators RANKED (With Proof!)
Most Effective MACD Strategy for Daytrading Crypto, Forex & Stocks (High Winrate Strategy)

Best AI TradingView Indicator in 2024 | 100% Winning Strategy 🔥

🔴 (100% SNIPER Entries) - This "MACD-STOCHASTIC-RSI" Strategy Will Make You Filthy RICH

MACD INDICATOR EXPLAINED (Trade with the trend)
5.0 / 5 (0 votes)