ICT Forex - Market Maker Series Vol. 3 of 5
Summary
TLDRThis video explains how to read market structure through the lens of the Market Maker Buy and Sell Models, focusing on key higher-timeframe levels, consolidation, liquidity, and smart money behavior. It shows how price typically moves from consolidation into expansion, targets liquidity, and then reverses near significant monthly, weekly, or daily levels. The script emphasizes using SMT (Smart Money Technique) as confirmation between correlated or inverse markets, not as a standalone signal. Viewers are encouraged to study historical price swings to recognize repeating patterns and develop a disciplined, probability-based framework for anticipating price delivery rather than reacting emotionally.
Takeaways
- 😀 Key levels in market analysis are primarily based on higher time frames (monthly, weekly, daily) to cater to large fund traders. Smaller time frames (e.g., 15-minute or 1-hour) are less significant for large players.
- 😀 The market is expected to react at key level lows after moving from its current position, and traders can choose whether to trade the move down or wait for the bounce off the key level.
- 😀 Trading strategies should be adaptable to different traders' preferences. There's no one-size-fits-all; each trader must find a method that suits their style and risk tolerance.
- 😀 Market makers use algorithms to control price movements, often creating artificial price actions such as consolidation and liquidity accumulation before reversing or moving to the next level.
- 😀 Smart Money Technique (SMT) involves identifying divergence between closely correlated markets. For example, if Euro-dollar is showing a higher low while Pound-dollar is showing a lower low, this signals a discrepancy in the algorithm's behavior, hinting at potential price movements.
- 😀 Price consolidations are key in understanding market movements. A consolidation on one time frame may look vastly different on another time frame (e.g., 15-minute vs. 4-hour).
- 😀 Price does not always need to revisit previous consolidation areas. However, if it does, the market is expected to sharply reject the return to that zone before continuing downward or upward.
- 😀 Optimal trade entries often occur after price forms short-term highs or lows, followed by sharp movements, either up or down. Traders should be prepared for these price shifts.
- 😀 Although losses are inevitable in trading, the key is not to fear them. If your analysis is correct, a drawdown can be overcome with subsequent opportunities that align with the original analysis.
- 😀 The algorithm often moves prices against retail traders by triggering stop-loss orders. Understanding this mechanism helps traders to align with the algorithm and avoid being caught in stop runs.
Q & A
What is the main focus of this video series on energy trading?
-The video series focuses on market structure, key levels, and smart money techniques (SMT). The goal is to teach traders how to understand price swings, key levels, and how large fund traders engage in the market using these concepts.
What defines a 'key level' in the market according to the script?
-A 'key level' is defined as significant levels on higher time frames such as monthly, weekly, and daily charts. These levels are important for large fund traders as they typically do not trade based on short-term time frames like 15-minute or 1-hour charts.
Why do large fund traders prefer higher time frames like monthly or weekly charts?
-Large fund traders prefer higher time frames because the volume they trade in requires a longer-term perspective. They are not concerned with intraday movements and prefer to focus on more significant trends, such as those seen on daily, weekly, and monthly charts.
What is the importance of a smart money divergence (SMT) in trading?
-SMT is important because it identifies divergences between closely correlated markets, indicating that one market may be stronger or weaker than expected. This often signals a change in market behavior and can help traders anticipate price movements, especially when one market is failing to follow the correlation.
What does the term 'optimal trade entry' refer to in the script?
-An 'optimal trade entry' refers to a precise setup where price retraces to a key level, such as a bearish or bullish order block, and then moves aggressively in the expected direction. This is a preferred entry point for traders seeking a low-risk trade with a high reward potential.
How does the 'market maker buy model' work, according to the speaker?
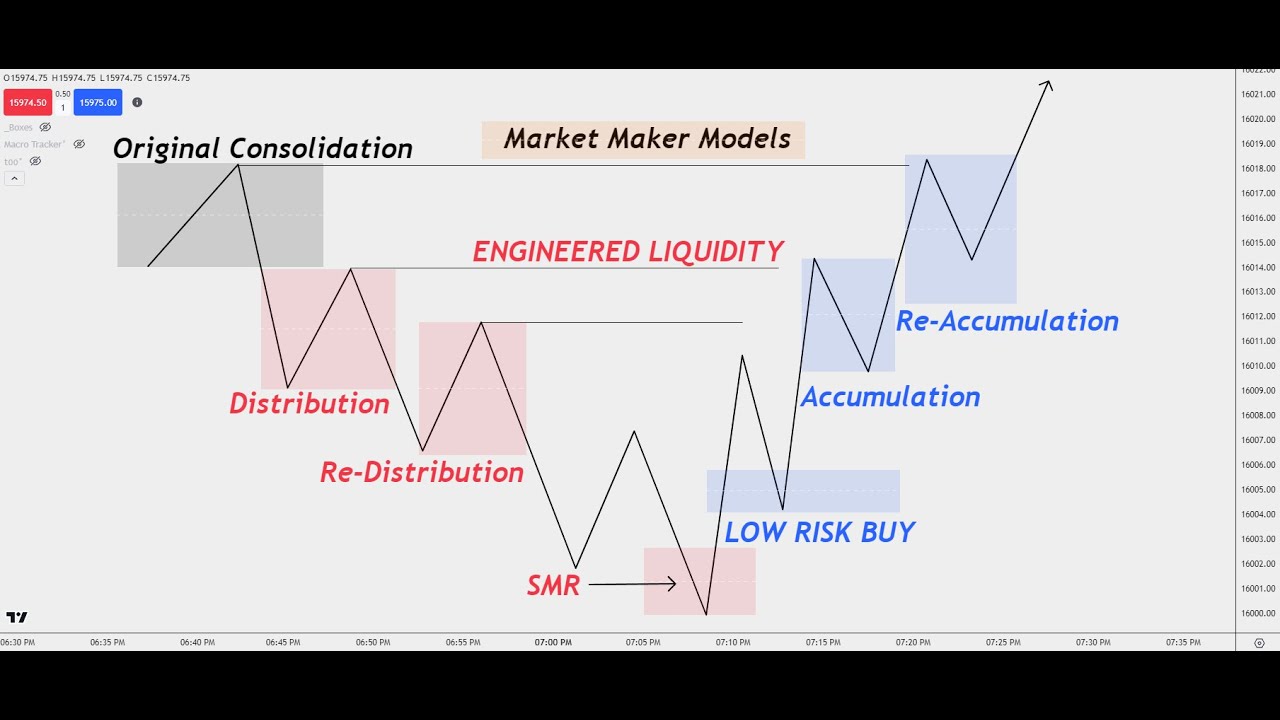
-The 'market maker buy model' works by first taking price down to a key level, often involving the accumulation of sell stops. Once these levels are reached, the price then reverses, with the market maker absorbing those sell orders and pushing the price higher. This process involves multiple levels of consolidation and distribution.
Why is studying past market data crucial for understanding price swings?
-Studying past market data is crucial because price swings repeat over time, and understanding these patterns can help traders anticipate future price movements. The more a trader studies historical price action, the better they become at recognizing these patterns in real-time.
How does the speaker suggest traders handle drawdowns or losing trades?
-The speaker suggests that traders should not fear losing trades or drawdowns, as these are part of the process. If the trader's analysis is correct, they will eventually capture a profitable move. The key is to remain patient and take advantage of future opportunities despite short-term losses.
What role does consolidation play in market movements, according to the speaker?
-Consolidation is important because it allows the algorithm to accumulate positions, either long or short, without causing a significant move in price. This consolidation often precedes a breakout in the direction of the accumulation, and traders look for these patterns to anticipate future price action.
What does the speaker mean by 'all boats rise with the tide' in market analysis?
-'All boats rise with the tide' refers to the idea that in correlated markets, if one currency pair (such as EUR/USD) is expected to rise, other related pairs (like GBP/USD) should also rise. This correlation is important for understanding market sentiment and timing trades based on inter-market relationships.
Outlines

This section is available to paid users only. Please upgrade to access this part.
Upgrade NowMindmap

This section is available to paid users only. Please upgrade to access this part.
Upgrade NowKeywords

This section is available to paid users only. Please upgrade to access this part.
Upgrade NowHighlights

This section is available to paid users only. Please upgrade to access this part.
Upgrade NowTranscripts

This section is available to paid users only. Please upgrade to access this part.
Upgrade NowBrowse More Related Video

EXPOSED - ICT’s Favorite Trading Strategy (Hear it From ICT Himself)

The only ICT MMXM video you'll ever need

ICT Market Maker Model - Explained In-depth!

How to Trade the ICT Market Maker Model (LIVE)

Market Maker Models Explained | Step By Step Approach | ICT Concepts
ICT Concepts: Understanding How To Trade ICT Market Maker Models!
5.0 / 5 (0 votes)